Estimated Value: $392,000 - $574,000
3
Beds
3
Baths
2,046
Sq Ft
$246/Sq Ft
Est. Value
About This Home
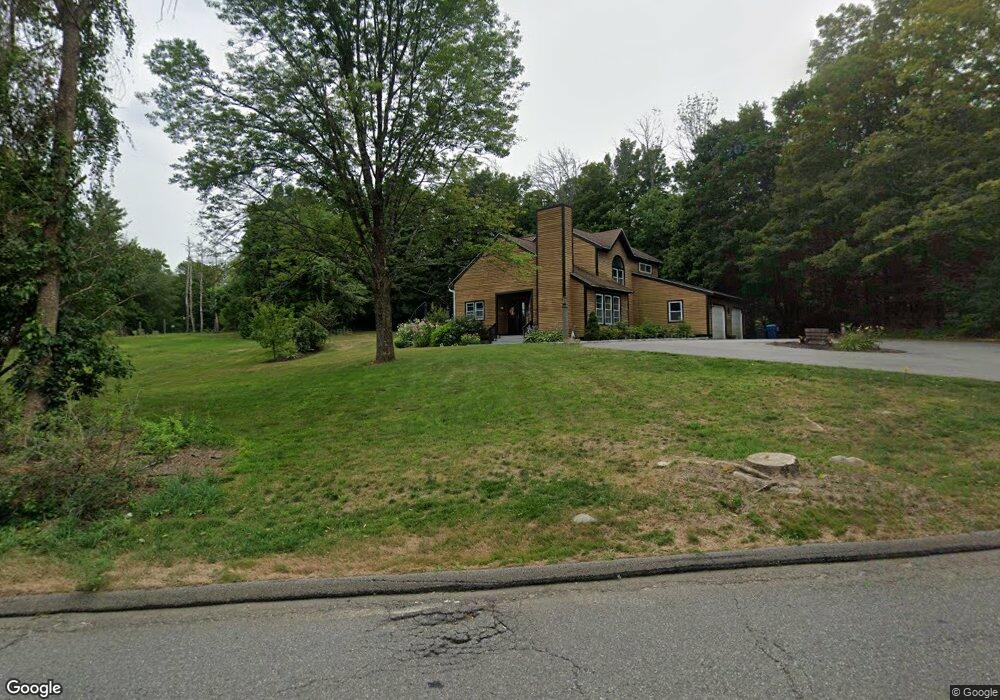
This home is located at 112 Summer St, Barre, MA 01005 and is currently estimated at $503,960, approximately $246 per square foot. 112 Summer St is a home located in Worcester County with nearby schools including Quabbin Regional Middle School and Quabbin Regional High School.
Ownership History
Date
Name
Owned For
Owner Type
Purchase Details
Closed on
Jul 29, 2009
Sold by
Degrace Gerald P and Degrace Barbara J
Bought by
Clark Irena
Current Estimated Value
Home Financials for this Owner
Home Financials are based on the most recent Mortgage that was taken out on this home.
Original Mortgage
$125,010
Outstanding Balance
$81,753
Interest Rate
5.43%
Mortgage Type
Purchase Money Mortgage
Estimated Equity
$422,207
Purchase Details
Closed on
Sep 29, 2000
Sold by
Hodson John L and Andrea Jafferian S
Bought by
Degrace Gerald P and Degrace Barbara J
Home Financials for this Owner
Home Financials are based on the most recent Mortgage that was taken out on this home.
Original Mortgage
$126,000
Interest Rate
7.94%
Mortgage Type
Purchase Money Mortgage
Create a Home Valuation Report for This Property
The Home Valuation Report is an in-depth analysis detailing your home's value as well as a comparison with similar homes in the area
Home Values in the Area
Average Home Value in this Area
Purchase History
| Date | Buyer | Sale Price | Title Company |
|---|---|---|---|
| Clark Irena | $219,900 | -- | |
| Clark Irena | $219,900 | -- | |
| Degrace Gerald P | $140,000 | -- | |
| Degrace Gerald P | $140,000 | -- |
Source: Public Records
Mortgage History
| Date | Status | Borrower | Loan Amount |
|---|---|---|---|
| Open | Clark Irena | $125,010 | |
| Closed | Degrace Gerald P | $125,010 | |
| Previous Owner | Degrace Gerald P | $126,000 | |
| Previous Owner | Degrace Gerald P | $48,000 |
Source: Public Records
Tax History Compared to Growth
Tax History
| Year | Tax Paid | Tax Assessment Tax Assessment Total Assessment is a certain percentage of the fair market value that is determined by local assessors to be the total taxable value of land and additions on the property. | Land | Improvement |
|---|---|---|---|---|
| 2025 | $7,204 | $530,100 | $70,800 | $459,300 |
| 2024 | $7,078 | $506,300 | $67,000 | $439,300 |
| 2023 | $6,566 | $414,000 | $52,400 | $361,600 |
| 2022 | $6,334 | $376,100 | $45,800 | $330,300 |
| 2021 | $5,740 | $318,900 | $45,800 | $273,100 |
| 2020 | $5,615 | $314,200 | $45,800 | $268,400 |
| 2019 | $4,746 | $261,900 | $41,800 | $220,100 |
| 2018 | $4,456 | $237,000 | $41,800 | $195,200 |
| 2017 | $3,575 | $191,200 | $41,800 | $149,400 |
| 2016 | $3,222 | $181,000 | $37,800 | $143,200 |
| 2015 | $3,301 | $177,100 | $45,900 | $131,200 |
| 2014 | $2,973 | $185,100 | $53,900 | $131,200 |
Source: Public Records
Map
Nearby Homes