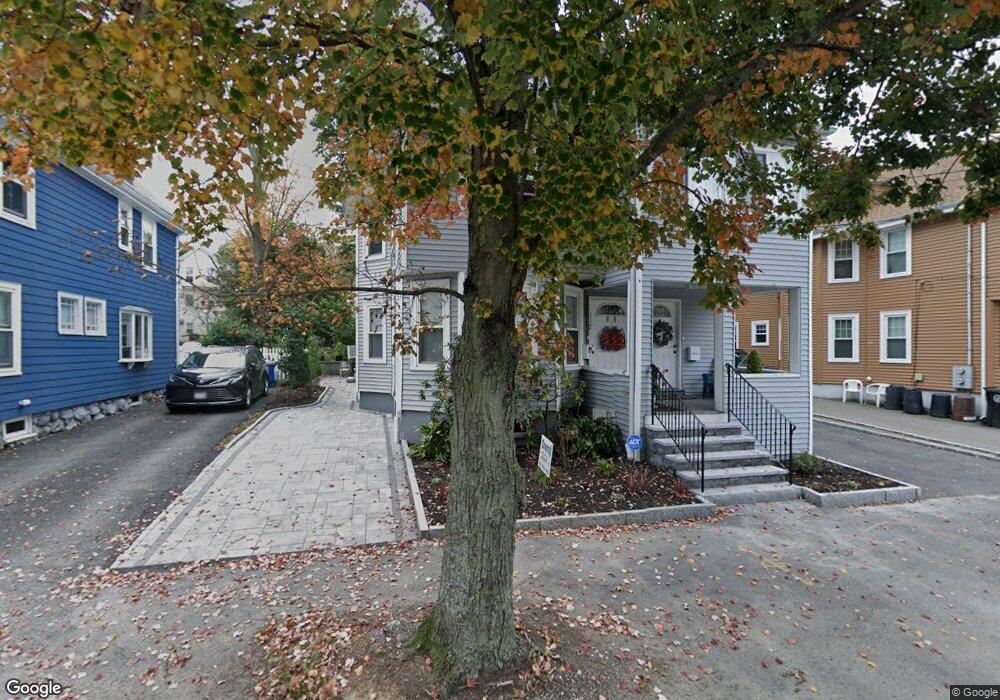
112 Sycamore St Unit 114 Belmont, MA 02478
Waverley Square NeighborhoodEstimated Value: $1,184,365 - $1,299,000
4
Beds
3
Baths
2,864
Sq Ft
$432/Sq Ft
Est. Value
About This Home
This home is located at 112 Sycamore St Unit 114, Belmont, MA 02478 and is currently estimated at $1,238,091, approximately $432 per square foot. 112 Sycamore St Unit 114 is a home located in Middlesex County with nearby schools including Daniel Butler School, Winthrop L Chenery Middle School, and Belmont High School.
Ownership History
Date
Name
Owned For
Owner Type
Purchase Details
Closed on
Jan 28, 2021
Sold by
Nalbandian Brothers Rt
Bought by
Cosco Vanessa and Cosco Franca R
Current Estimated Value
Home Financials for this Owner
Home Financials are based on the most recent Mortgage that was taken out on this home.
Original Mortgage
$650,000
Outstanding Balance
$581,052
Interest Rate
2.67%
Mortgage Type
Purchase Money Mortgage
Estimated Equity
$657,039
Purchase Details
Closed on
Oct 21, 2009
Sold by
Nalbandian James Y and Nalbandian Richard S
Bought by
Nalbandian Brothers Rt and Nalbandian Richard S
Purchase Details
Closed on
May 28, 1999
Sold by
Khalarian Paul and Khalarian Janet
Bought by
Nalbandian James Y and Nalbandian Richard S
Purchase Details
Closed on
Jan 20, 1999
Sold by
Hynes James
Bought by
Khalarian Paul and Khalarian Janet
Home Financials for this Owner
Home Financials are based on the most recent Mortgage that was taken out on this home.
Original Mortgage
$150,000
Interest Rate
6.7%
Mortgage Type
Purchase Money Mortgage
Create a Home Valuation Report for This Property
The Home Valuation Report is an in-depth analysis detailing your home's value as well as a comparison with similar homes in the area
Home Values in the Area
Average Home Value in this Area
Purchase History
| Date | Buyer | Sale Price | Title Company |
|---|---|---|---|
| Cosco Vanessa | $915,000 | None Available | |
| Nalbandian Brothers Rt | -- | -- | |
| Nalbandian James Y | $380,000 | -- | |
| Khalarian Paul | $250,000 | -- |
Source: Public Records
Mortgage History
| Date | Status | Borrower | Loan Amount |
|---|---|---|---|
| Open | Cosco Vanessa | $650,000 | |
| Previous Owner | Khalarian Paul | $150,000 |
Source: Public Records
Tax History Compared to Growth
Tax History
| Year | Tax Paid | Tax Assessment Tax Assessment Total Assessment is a certain percentage of the fair market value that is determined by local assessors to be the total taxable value of land and additions on the property. | Land | Improvement |
|---|---|---|---|---|
| 2025 | $9,852 | $865,000 | $553,000 | $312,000 |
| 2024 | $10,064 | $953,000 | $732,000 | $221,000 |
| 2023 | $10,037 | $893,000 | $691,000 | $202,000 |
| 2022 | $11,456 | $991,000 | $632,000 | $359,000 |
| 2021 | $10,975 | $951,000 | $699,000 | $252,000 |
| 2020 | $9,603 | $873,000 | $584,000 | $289,000 |
| 2019 | $9,231 | $791,000 | $429,000 | $362,000 |
| 2018 | $9,137 | $752,000 | $390,000 | $362,000 |
| 2017 | $9,137 | $720,000 | $358,000 | $362,000 |
| 2016 | $8,503 | $677,000 | $318,000 | $359,000 |
| 2015 | $7,379 | $572,000 | $290,000 | $282,000 |
Source: Public Records
Map
Nearby Homes
- 1 Bridgham Ave
- 50 Moraine St
- 236 Sycamore St
- 17 Ripley Rd
- 3 Waverley St Unit 1
- 24 Gill Rd Unit 4
- 253 Sycamore St Unit 253
- 914 Belmont St
- 30 Duff St
- 99 Beech St
- 356 Lexington St
- 31 Grant Ave Unit 33
- 57 Pierce Rd Unit 57
- 28 Whitney St
- 26 Ridge Rd
- 88 Bartlett Ave
- 287 Lexington St
- 289 Waverley Ave Unit 2
- 5 Meadows Ln Unit 105
- 51 S Cottage Rd Unit 112
- 112 Sycamore St Unit U:1
- 112 Sycamore St Unit 2
- 116 Sycamore St Unit 118
- 104 Sycamore St Unit 106
- 108 Sycamore St
- 120 Sycamore St
- 111 Sycamore St Unit 113
- 126 Sycamore St
- 115 Sycamore St Unit 117
- 106 Sycamore St
- 33 Chandler St
- 39-41 Chandler St Unit 1
- 39-41 Chandler St Unit 2
- 39-41 Chandler St
- 127 Sycamore St Unit 129
- 105-107 Sycamore St
- 124 Sycamore St
- 105 Sycamore St Unit 107
- 35 Chandler St Unit 37
- 39 Chandler St Unit 41