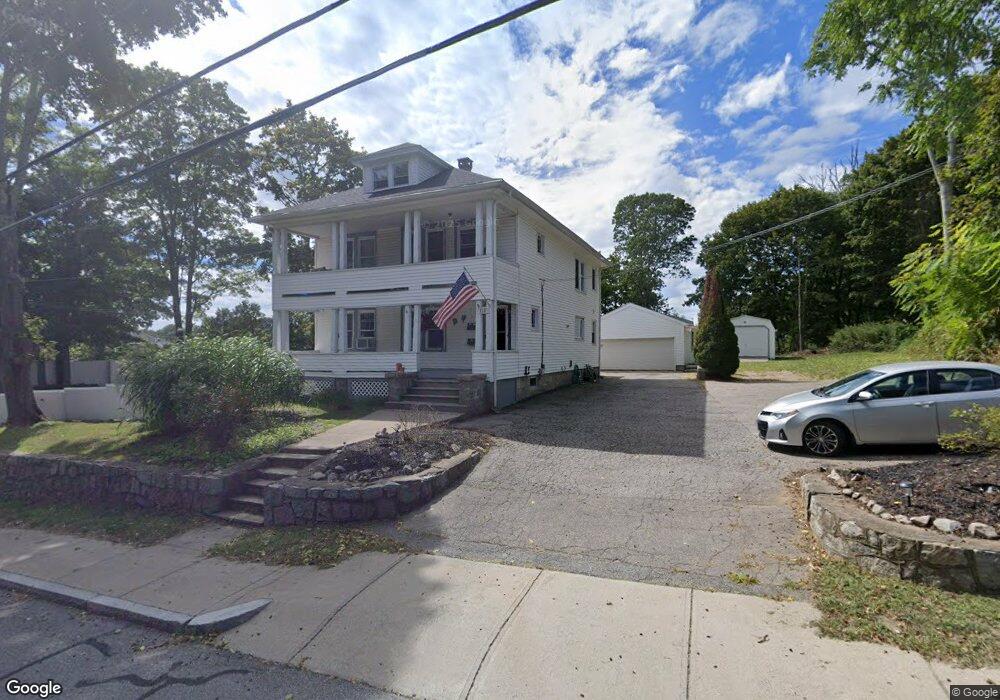
112 Tower St Westerly, RI 02891
Estimated Value: $422,000 - $540,000
4
Beds
2
Baths
2,128
Sq Ft
$222/Sq Ft
Est. Value
About This Home
This home is located at 112 Tower St, Westerly, RI 02891 and is currently estimated at $472,225, approximately $221 per square foot. 112 Tower St is a home located in Washington County with nearby schools including Westerly High School and St. Michael School.
Ownership History
Date
Name
Owned For
Owner Type
Purchase Details
Closed on
Mar 3, 2017
Sold by
Bank New York Mellon T
Bought by
Gilmore Stiles
Current Estimated Value
Purchase Details
Closed on
Jan 26, 2016
Sold by
Jones Renee and Bank New York Mellon
Bought by
Bank New York Mellon T
Purchase Details
Closed on
Apr 9, 2003
Sold by
Newman John and Newman Tamaralyn
Bought by
Jones Jeffrey and Jones Renee
Home Financials for this Owner
Home Financials are based on the most recent Mortgage that was taken out on this home.
Original Mortgage
$143,500
Interest Rate
5.86%
Purchase Details
Closed on
Jan 24, 1995
Sold by
Chimento John and Chimento Frank
Bought by
Newman John W and Newman Tamaralynn
Home Financials for this Owner
Home Financials are based on the most recent Mortgage that was taken out on this home.
Original Mortgage
$109,200
Interest Rate
9.16%
Create a Home Valuation Report for This Property
The Home Valuation Report is an in-depth analysis detailing your home's value as well as a comparison with similar homes in the area
Home Values in the Area
Average Home Value in this Area
Purchase History
| Date | Buyer | Sale Price | Title Company |
|---|---|---|---|
| Gilmore Stiles | $166,299 | -- | |
| Bank New York Mellon T | $226,000 | -- | |
| Jones Jeffrey | $205,000 | -- | |
| Newman John W | $115,000 | -- |
Source: Public Records
Mortgage History
| Date | Status | Borrower | Loan Amount |
|---|---|---|---|
| Previous Owner | Newman John W | $169,000 | |
| Previous Owner | Newman John W | $143,500 | |
| Previous Owner | Newman John W | $109,200 |
Source: Public Records
Tax History
| Year | Tax Paid | Tax Assessment Tax Assessment Total Assessment is a certain percentage of the fair market value that is determined by local assessors to be the total taxable value of land and additions on the property. | Land | Improvement |
|---|---|---|---|---|
| 2025 | $3,031 | $389,600 | $148,900 | $240,700 |
| 2024 | $2,794 | $267,400 | $107,700 | $159,700 |
| 2023 | $2,717 | $267,400 | $107,700 | $159,700 |
| 2022 | $2,701 | $267,400 | $107,700 | $159,700 |
| 2021 | $2,856 | $236,800 | $94,300 | $142,500 |
| 2020 | $2,806 | $236,800 | $94,300 | $142,500 |
| 2019 | $2,780 | $236,800 | $94,300 | $142,500 |
| 2018 | $2,822 | $228,500 | $94,300 | $134,200 |
| 2017 | $2,742 | $228,500 | $94,300 | $134,200 |
| 2016 | $2,742 | $228,500 | $94,300 | $134,200 |
| 2015 | $2,668 | $237,600 | $96,100 | $141,500 |
| 2014 | $2,625 | $237,600 | $96,100 | $141,500 |
Source: Public Records
Map
Nearby Homes
- 52 Bellevue Ave
- 12 Batterson Ave
- 2 Marichris Dr
- 5 Marion St
- 0 Iroquois Ave
- 7 Dixon St
- 19 Apache Dr Unit F
- 19 Apache Dr Unit 19C
- 12 Apache Dr Unit A
- 17 West St Unit 3
- 17 Apache Dr Unit G
- 14 George St
- 199 High St
- 16 Spring St
- 25 School St Unit 2
- 55 Pleasant St
- 3 Columbus Ave
- 7 Schilke Dr
- 13 Moss St
- 141 W Broad St
- 74 Narragansett Ave
- 111 Tower St
- 70 Narragansett Ave
- 116 Tower St
- 113 Tower St
- 118 Tower St
- 101 Tower St
- 77 Narragansett Ave
- 71 Narragansett Ave
- 77 Narragansett Ave
- 77 Narragansett Ave
- 80 Narragansett Ave
- 66 Narragansett Ave
- 69 Narragansett Ave
- 27 Top St
- 115 Tower St
- 67 Narragansett Ave
- 82 Narragansett Ave
- 120 Tower St
- 84 Tower St
Your Personal Tour Guide
Ask me questions while you tour the home.