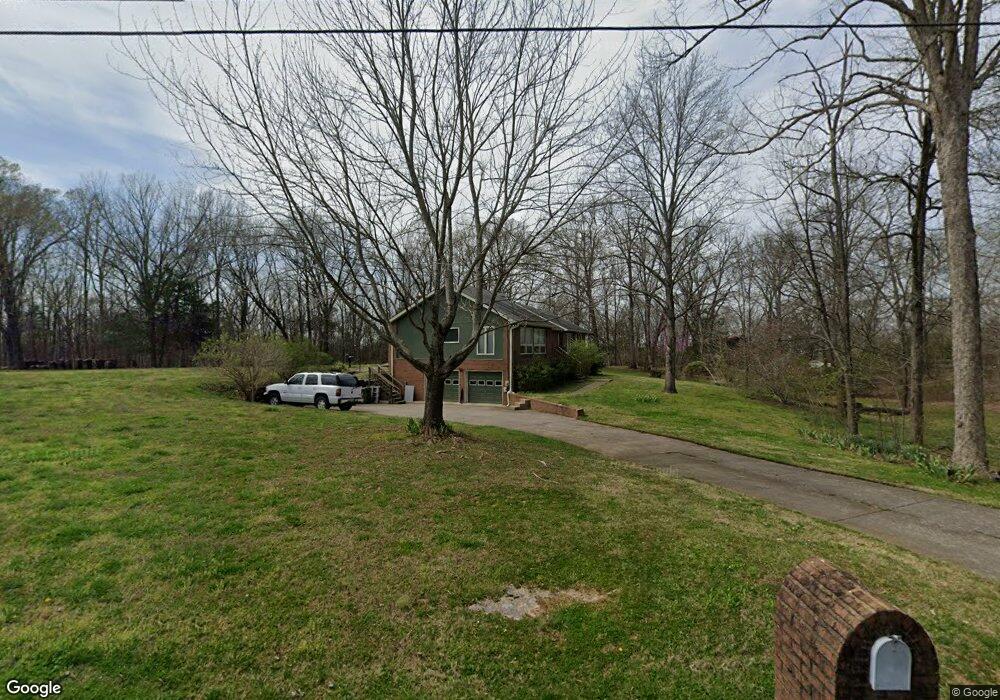
112 Tulip Poplar Dr La Vergne, TN 37086
Estimated Value: $422,000 - $564,496
--
Bed
3
Baths
2,118
Sq Ft
$233/Sq Ft
Est. Value
About This Home
This home is located at 112 Tulip Poplar Dr, La Vergne, TN 37086 and is currently estimated at $494,374, approximately $233 per square foot. 112 Tulip Poplar Dr is a home located in Rutherford County with nearby schools including LaVergne Lake Elementary School, La Vergne Middle School, and Lavergne High School.
Ownership History
Date
Name
Owned For
Owner Type
Purchase Details
Closed on
Oct 3, 2018
Sold by
Lanker Larry D and Lanker Stacy L
Bought by
Lanker Larry D and Lanker Stacy L
Current Estimated Value
Home Financials for this Owner
Home Financials are based on the most recent Mortgage that was taken out on this home.
Original Mortgage
$250,000
Outstanding Balance
$218,015
Interest Rate
4.5%
Mortgage Type
VA
Estimated Equity
$276,359
Purchase Details
Closed on
Dec 31, 2014
Sold by
Lanker Larry D
Bought by
Lanker Larry D
Purchase Details
Closed on
Jul 26, 2013
Sold by
Armour Peggy L Irrevocable
Bought by
Lanker Larry D
Home Financials for this Owner
Home Financials are based on the most recent Mortgage that was taken out on this home.
Original Mortgage
$179,900
Interest Rate
4.43%
Mortgage Type
VA
Purchase Details
Closed on
Nov 17, 2012
Sold by
Armour Charles W
Bought by
Armour Peggy L Irrevocable T and Lawson Stephanie C (Tr)
Create a Home Valuation Report for This Property
The Home Valuation Report is an in-depth analysis detailing your home's value as well as a comparison with similar homes in the area
Home Values in the Area
Average Home Value in this Area
Purchase History
| Date | Buyer | Sale Price | Title Company |
|---|---|---|---|
| Lanker Larry D | -- | Db Title Llc | |
| Lanker Larry D | -- | -- | |
| Lanker Larry D | $179,900 | -- | |
| Armour Peggy L Irrevocable T | -- | -- |
Source: Public Records
Mortgage History
| Date | Status | Borrower | Loan Amount |
|---|---|---|---|
| Open | Lanker Larry D | $250,000 | |
| Previous Owner | Lanker Larry D | $179,900 |
Source: Public Records
Tax History Compared to Growth
Tax History
| Year | Tax Paid | Tax Assessment Tax Assessment Total Assessment is a certain percentage of the fair market value that is determined by local assessors to be the total taxable value of land and additions on the property. | Land | Improvement |
|---|---|---|---|---|
| 2025 | $2,705 | $112,150 | $25,850 | $86,300 |
| 2024 | $2,705 | $112,150 | $25,850 | $86,300 |
| 2023 | $2,104 | $112,150 | $25,850 | $86,300 |
| 2022 | $1,813 | $112,150 | $25,850 | $86,300 |
| 2021 | $1,386 | $62,450 | $15,325 | $47,125 |
| 2020 | $1,386 | $62,450 | $15,325 | $47,125 |
| 2019 | $1,386 | $62,450 | $15,325 | $47,125 |
Source: Public Records
Map
Nearby Homes
- 143 Vaughnwood Dr
- 303 Amit St
- 101 Kalman Minuskin Blvd
- 733 Hollandale Rd
- 699 Hollandale Rd
- 514 Bon Aqua Dr
- 603 E Lake Cove
- 507 Jerald Smith Ln
- 166 Oasis Dr
- 164 Oasis Dr
- 160 Oasis Dr
- 154 Oasis Dr
- 205 Clearlake Dr
- 618 Cedar Bend Ln
- 605 Hollandale Rd
- 603 Hollandale Rd
- 303 Holland Ridge Dr
- 800 Troy Cove
- 396 Davids Way
- 607 Mable Dr
- 106 Lakewood Dr
- 120 Lakewood Dr
- 118 Tulip Poplar Dr
- 141 Tulip Poplar Dr
- 124 Tulip Poplar Dr
- 136 Lakewood Dr
- 149 Tulip Poplar Dr
- 137 Lakewood Dr
- 130 Tulip Poplar Dr
- 120 Vaughnwood Dr
- 132 Vaughwood
- 132 Vaunghnwood Dr
- 132 Vaughnwood Dr
- 107 Lakewood Dr
- 107 Lakewood Dr
- 107 Lakewood Dr
- 107 Lakewood Dr
- 155 Tulip Poplar Dr
- 140 Vaughnwood Dr
- 150 Jonas Rd