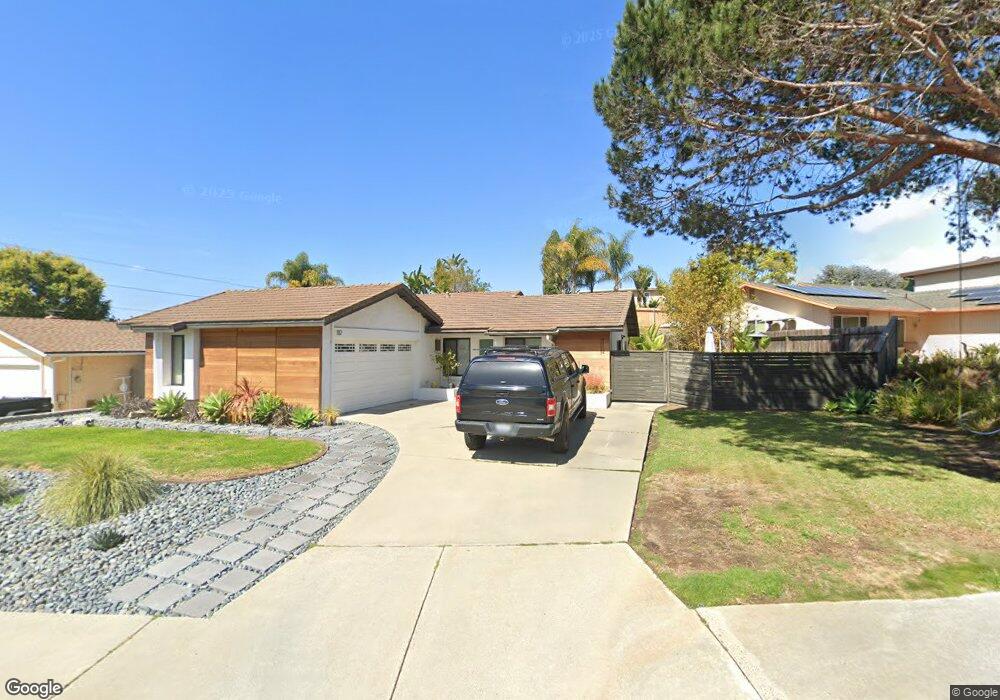
112 Village Run E Encinitas, CA 92024
Central Encinitas NeighborhoodEstimated Value: $1,398,769 - $1,520,000
3
Beds
2
Baths
1,266
Sq Ft
$1,160/Sq Ft
Est. Value
About This Home
This home is located at 112 Village Run E, Encinitas, CA 92024 and is currently estimated at $1,468,692, approximately $1,160 per square foot. 112 Village Run E is a home located in San Diego County with nearby schools including Park Dale Lane Elementary, Diegueno Middle School, and La Costa Canyon High School.
Ownership History
Date
Name
Owned For
Owner Type
Purchase Details
Closed on
May 5, 2021
Sold by
Kelting Timothy J and Kelting Katharina L
Bought by
Kelting Family Trust and Kelting
Current Estimated Value
Purchase Details
Closed on
Mar 22, 2010
Sold by
Cheng Jian and Denton Katherine
Bought by
Kelting Timothy J and Kelting Katharina L
Purchase Details
Closed on
Dec 27, 2002
Sold by
Torbett Bruce E and Holmes Emily M
Bought by
Cheng Jian and Denton Katherine
Home Financials for this Owner
Home Financials are based on the most recent Mortgage that was taken out on this home.
Original Mortgage
$322,700
Interest Rate
6.15%
Mortgage Type
Purchase Money Mortgage
Purchase Details
Closed on
Apr 25, 1989
Create a Home Valuation Report for This Property
The Home Valuation Report is an in-depth analysis detailing your home's value as well as a comparison with similar homes in the area
Home Values in the Area
Average Home Value in this Area
Purchase History
| Date | Buyer | Sale Price | Title Company |
|---|---|---|---|
| Kelting Family Trust | -- | Shepard Kristan | |
| Kelting Timothy J | -- | Shepard Kristan | |
| Kelting Timothy J | $512,500 | Fidelity National Title | |
| Cheng Jian | $412,500 | Equity Title Company | |
| -- | $197,900 | -- |
Source: Public Records
Mortgage History
| Date | Status | Borrower | Loan Amount |
|---|---|---|---|
| Previous Owner | Cheng Jian | $322,700 |
Source: Public Records
Tax History
| Year | Tax Paid | Tax Assessment Tax Assessment Total Assessment is a certain percentage of the fair market value that is determined by local assessors to be the total taxable value of land and additions on the property. | Land | Improvement |
|---|---|---|---|---|
| 2025 | $7,453 | $661,529 | $473,097 | $188,432 |
| 2024 | $7,453 | $648,559 | $463,821 | $184,738 |
| 2023 | $7,235 | $635,843 | $454,727 | $181,116 |
| 2022 | $7,058 | $623,376 | $445,811 | $177,565 |
| 2021 | $6,935 | $611,154 | $437,070 | $174,084 |
| 2020 | $6,820 | $604,888 | $432,589 | $172,299 |
| 2019 | $6,685 | $593,028 | $424,107 | $168,921 |
| 2018 | $6,572 | $581,401 | $415,792 | $165,609 |
| 2017 | $6,459 | $570,002 | $407,640 | $162,362 |
| 2016 | $6,262 | $558,827 | $399,648 | $159,179 |
| 2015 | $6,148 | $550,433 | $393,645 | $156,788 |
| 2014 | $6,003 | $539,652 | $385,935 | $153,717 |
Source: Public Records
Map
Nearby Homes
- 1741 Charleston Ln
- 114 Cerro St
- 1644 Forestdale Dr
- 1824 Eastwood Ln
- 1830 Gatepost Rd
- 1926 Springdale Ln
- 1517 Shields Ave
- 324 Countrywood Ln
- 349 Horizon Dr
- 1709 Edgefield Ln
- 1617 Blossom Field Way
- 1642 Blossom Field Way
- 608 Crest Dr
- 1971 Azure Way
- 2037 Countrywood Way
- 2118 Valleydale Ln
- 1986 Azure Way Unit 107
- 1733 Gentle Breeze Ln
- 1982 Fairlee Dr
- 1105 Catania Ct Unit 201
- 112 Village Run E
- 120 Village Run E Unit 1
- 104 Village Run E Unit 1
- 128 Village Run E
- 111 Village Run E
- 1715 Old Mill Ct
- 1711 Old Mill Ct
- 111 Village Run W
- 121 Village Run E
- 1719 Old Mill Ct
- 136 Village Run E
- 127 Village Run E
- 107 Woodshadow Ln
- 135 Village Run E
- 135 Village Green Rd
- 119 Village Run W
- 103 Village Run E
- 1723 Old Mill Ct
- 144 Village Run E
- 1709 Old Mill Rd
Your Personal Tour Guide
Ask me questions while you tour the home.