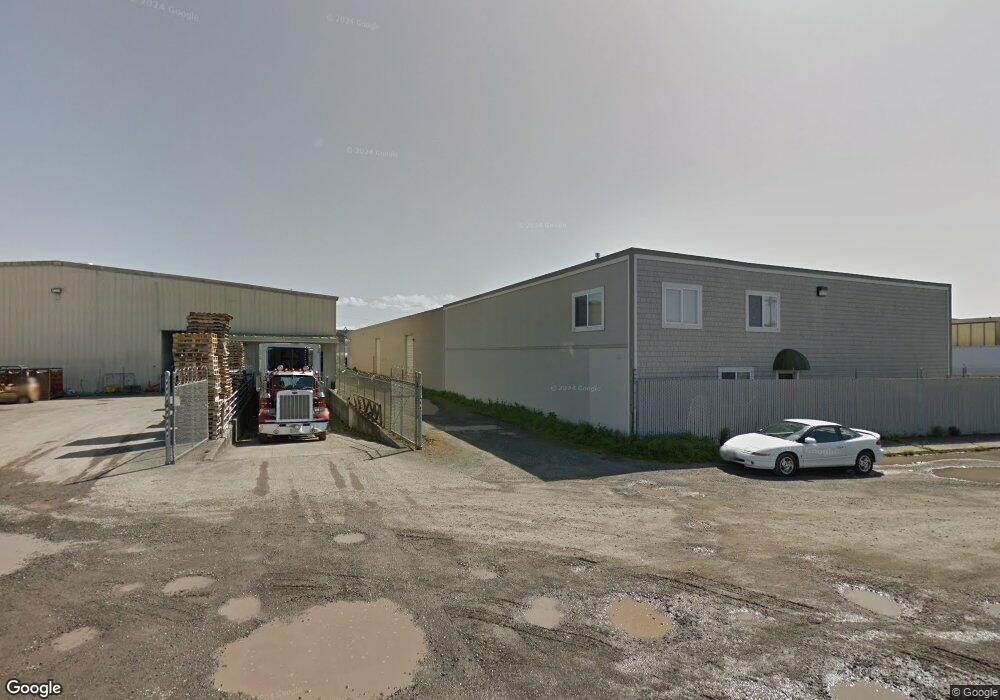
112 W 3rd St Eureka, CA 95501
Broadway Street NeighborhoodEstimated Value: $1,659,653
Studio
--
Bath
2,400
Sq Ft
$692/Sq Ft
Est. Value
About This Home
This home is located at 112 W 3rd St, Eureka, CA 95501 and is currently estimated at $1,659,653, approximately $691 per square foot. 112 W 3rd St is a home located in Humboldt County with nearby schools including Lafayette Elementary School, Catherine L. Zane Middle School, and Eureka Senior High School.
Ownership History
Date
Name
Owned For
Owner Type
Purchase Details
Closed on
Jun 10, 2010
Sold by
Lundblade Charlene J
Bought by
Lundblade Charlene June and The 2010 Charlene June Lundbla
Current Estimated Value
Purchase Details
Closed on
Sep 30, 2003
Sold by
1031 Reverse Exchange Co Inc
Bought by
Lundblade Charlene J
Purchase Details
Closed on
Feb 3, 2003
Sold by
Thompson William C and Thompson Juanita C
Bought by
Lundblade Charlene J and 1031 Reverse Exchange Co Inc
Create a Home Valuation Report for This Property
The Home Valuation Report is an in-depth analysis detailing your home's value as well as a comparison with similar homes in the area
Home Values in the Area
Average Home Value in this Area
Purchase History
| Date | Buyer | Sale Price | Title Company |
|---|---|---|---|
| Lundblade Charlene June | -- | None Available | |
| Lundblade Charlene J | $219,000 | Humboldt Land Title Company | |
| Lundblade Charlene J | $625,000 | Humboldt Land Title Company |
Source: Public Records
Tax History
| Year | Tax Paid | Tax Assessment Tax Assessment Total Assessment is a certain percentage of the fair market value that is determined by local assessors to be the total taxable value of land and additions on the property. | Land | Improvement |
|---|---|---|---|---|
| 2025 | $12,862 | $1,250,642 | $367,079 | $883,563 |
| 2024 | $12,862 | $1,226,121 | $359,882 | $866,239 |
| 2023 | $12,682 | $1,202,080 | $352,826 | $849,254 |
| 2022 | $13,164 | $1,178,510 | $345,908 | $832,602 |
| 2021 | $12,328 | $1,155,403 | $339,126 | $816,277 |
| 2020 | $12,236 | $1,143,557 | $335,649 | $807,908 |
| 2019 | $11,985 | $1,121,135 | $329,068 | $792,067 |
| 2018 | $11,805 | $1,099,153 | $322,616 | $776,537 |
| 2017 | $11,746 | $1,077,602 | $316,291 | $761,311 |
| 2016 | $11,748 | $1,056,474 | $310,090 | $746,384 |
| 2015 | -- | $1,040,606 | $305,433 | $735,173 |
| 2014 | $10,886 | $1,020,222 | $299,450 | $720,772 |
Source: Public Records
Map
Nearby Homes
Your Personal Tour Guide
Ask me questions while you tour the home.