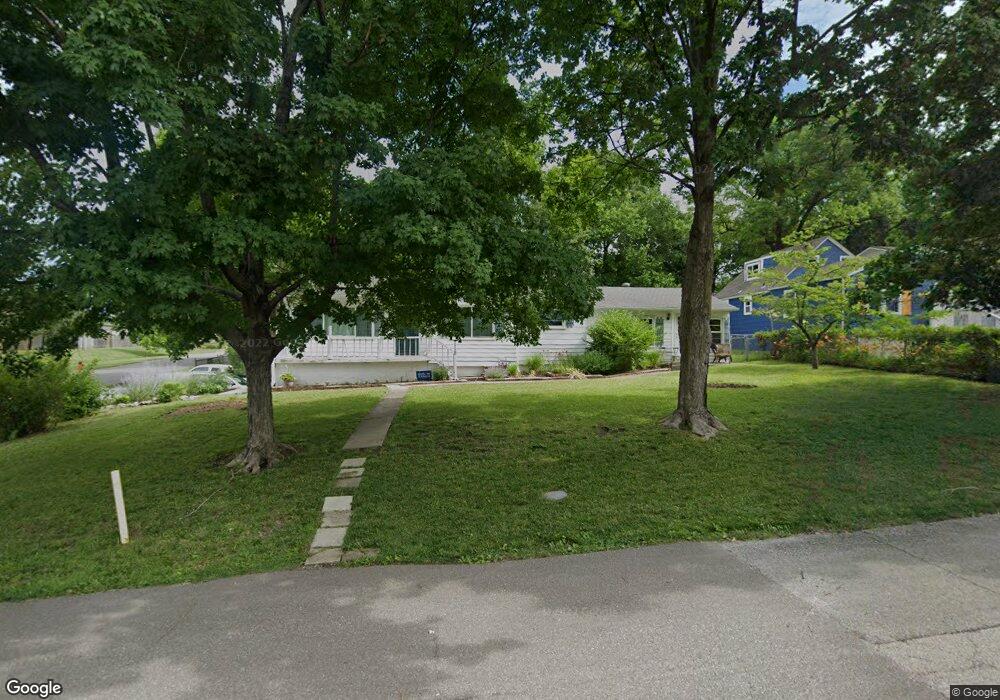
112 W 81st St Kansas City, MO 64114
Waldo NeighborhoodEstimated Value: $254,000 - $361,000
2
Beds
2
Baths
1,977
Sq Ft
$155/Sq Ft
Est. Value
About This Home
This home is located at 112 W 81st St, Kansas City, MO 64114 and is currently estimated at $306,160, approximately $154 per square foot. 112 W 81st St is a home located in Jackson County with nearby schools including John T. Hartman Elementary School, Central Middle School, and Southeast High School.
Ownership History
Date
Name
Owned For
Owner Type
Purchase Details
Closed on
Nov 12, 2020
Sold by
Fox Susan and Fox Darren A
Bought by
Fox Darren A and Harris Anne
Current Estimated Value
Home Financials for this Owner
Home Financials are based on the most recent Mortgage that was taken out on this home.
Original Mortgage
$125,000
Outstanding Balance
$111,432
Interest Rate
2.9%
Mortgage Type
New Conventional
Estimated Equity
$194,728
Purchase Details
Closed on
Feb 24, 2020
Sold by
Fox Susan
Bought by
Fox Susan and Fox Darren
Purchase Details
Closed on
Sep 22, 1997
Sold by
Napier Lola A
Bought by
Fox Susan
Home Financials for this Owner
Home Financials are based on the most recent Mortgage that was taken out on this home.
Original Mortgage
$47,955
Interest Rate
7.56%
Mortgage Type
FHA
Purchase Details
Closed on
Sep 6, 1997
Sold by
Napier Lola A and Napier Evelyn Hilda
Bought by
Napier Lola Ann
Home Financials for this Owner
Home Financials are based on the most recent Mortgage that was taken out on this home.
Original Mortgage
$47,955
Interest Rate
7.56%
Mortgage Type
FHA
Create a Home Valuation Report for This Property
The Home Valuation Report is an in-depth analysis detailing your home's value as well as a comparison with similar homes in the area
Home Values in the Area
Average Home Value in this Area
Purchase History
| Date | Buyer | Sale Price | Title Company |
|---|---|---|---|
| Fox Darren A | -- | None Available | |
| Fox Susan | -- | None Available | |
| Fox Susan | -- | Security Land Title Company | |
| Napier Lola Ann | -- | -- |
Source: Public Records
Mortgage History
| Date | Status | Borrower | Loan Amount |
|---|---|---|---|
| Open | Fox Darren A | $125,000 | |
| Closed | Fox Susan | $47,955 |
Source: Public Records
Tax History Compared to Growth
Tax History
| Year | Tax Paid | Tax Assessment Tax Assessment Total Assessment is a certain percentage of the fair market value that is determined by local assessors to be the total taxable value of land and additions on the property. | Land | Improvement |
|---|---|---|---|---|
| 2025 | $4,628 | $44,977 | $6,099 | $38,878 |
| 2024 | $4,584 | $58,634 | $7,644 | $50,990 |
| 2023 | $4,584 | $58,634 | $5,035 | $53,599 |
| 2022 | $2,798 | $34,010 | $6,660 | $27,350 |
| 2021 | $2,788 | $34,010 | $6,660 | $27,350 |
| 2020 | $2,472 | $29,774 | $6,660 | $23,114 |
| 2019 | $2,420 | $29,774 | $6,660 | $23,114 |
| 2018 | $1,813 | $22,775 | $2,812 | $19,963 |
| 2017 | $1,731 | $22,775 | $2,812 | $19,963 |
| 2016 | $1,731 | $21,628 | $3,416 | $18,212 |
| 2014 | $1,702 | $21,204 | $3,349 | $17,855 |
Source: Public Records
Map
Nearby Homes
- 208 W 81st Terrace
- 109 W 80th St
- 216 W 82nd St
- 11 E 80th Terrace
- 8005 Main St
- 102 E 81st St
- 206 W 82nd Terrace
- 18 W 79th Terrace
- 205 W 82nd Terrace
- 206 E 80th St
- 219 E 80th St
- 8216 Grand Ave
- 8217 Walnut St
- 24 W 78th Terrace
- 119 E 78th Terrace
- 14 W 78th St
- 8117 Summit St
- 208 W 81st St
- 7744 Grand Ave
- 7701 Walnut St
- 106 W 81st St
- 111 W 80th Terrace
- 104 W 81st St
- 102 W 81st St
- 115 W 81st St
- 105 W 81st St
- 115 W 80th Terrace
- 109 W 80th Terrace
- 100 W 81st St
- 103 W 81st St
- 107 W 80th Terrace
- 206 W 81st St
- 101 W 81st St
- 101 W 80th Terrace
- 21 W 81st St
- 20 W 81st St
- 16 W 81st St
- 209 W 81st St
- 207 W 81st St
- 25 W 80th Terrace