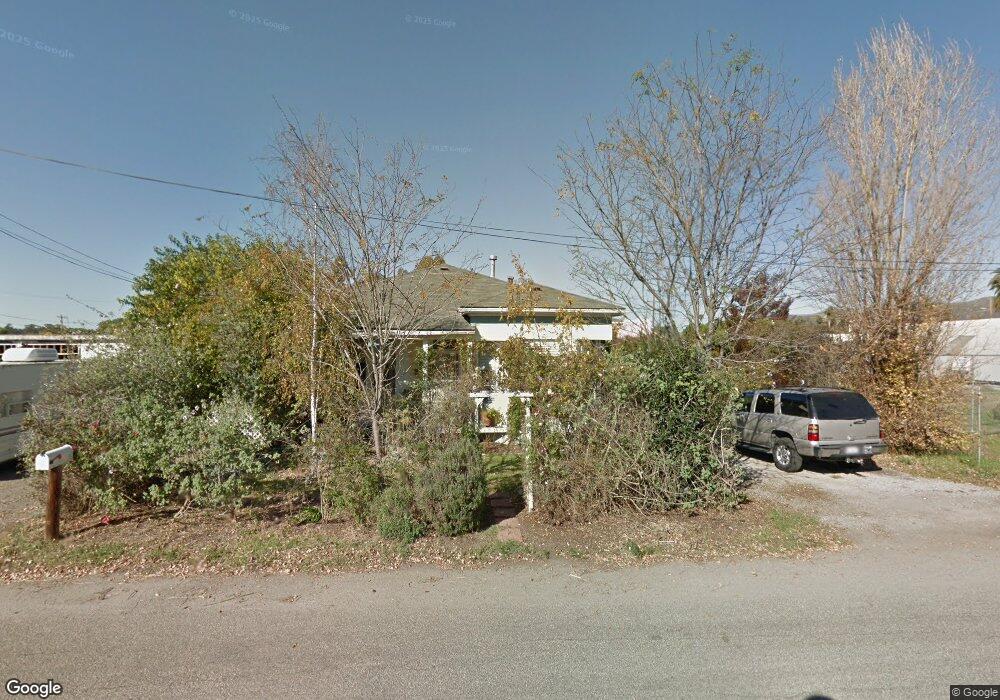
112 W Price St Unit A & Nipomo, CA 93444
Estimated Value: $590,000 - $954,000
3
Beds
2
Baths
1,584
Sq Ft
$452/Sq Ft
Est. Value
About This Home
This home is located at 112 W Price St Unit A &, Nipomo, CA 93444 and is currently estimated at $716,512, approximately $452 per square foot. 112 W Price St Unit A & is a home located in San Luis Obispo County with nearby schools including Nipomo Elementary School, Mesa Middle School, and Nipomo High School.
Ownership History
Date
Name
Owned For
Owner Type
Purchase Details
Closed on
Aug 9, 2000
Sold by
Martin Earlene
Bought by
Motley Charles A and Motley Jessica A
Current Estimated Value
Home Financials for this Owner
Home Financials are based on the most recent Mortgage that was taken out on this home.
Original Mortgage
$139,499
Outstanding Balance
$50,188
Interest Rate
8.11%
Mortgage Type
FHA
Estimated Equity
$666,324
Purchase Details
Closed on
Dec 13, 1995
Sold by
Kocian Virginia
Bought by
Martin Earlene
Purchase Details
Closed on
Jun 23, 1995
Sold by
Greene Helen
Bought by
Kocian Virginia
Home Financials for this Owner
Home Financials are based on the most recent Mortgage that was taken out on this home.
Original Mortgage
$90,000
Interest Rate
7.88%
Mortgage Type
Seller Take Back
Create a Home Valuation Report for This Property
The Home Valuation Report is an in-depth analysis detailing your home's value as well as a comparison with similar homes in the area
Home Values in the Area
Average Home Value in this Area
Purchase History
| Date | Buyer | Sale Price | Title Company |
|---|---|---|---|
| Motley Charles A | $141,000 | Chicago Title Co | |
| Martin Earlene | -- | -- | |
| Kocian Virginia | $120,000 | Chicago Title Company |
Source: Public Records
Mortgage History
| Date | Status | Borrower | Loan Amount |
|---|---|---|---|
| Open | Motley Charles A | $139,499 | |
| Previous Owner | Kocian Virginia | $90,000 |
Source: Public Records
Tax History Compared to Growth
Tax History
| Year | Tax Paid | Tax Assessment Tax Assessment Total Assessment is a certain percentage of the fair market value that is determined by local assessors to be the total taxable value of land and additions on the property. | Land | Improvement |
|---|---|---|---|---|
| 2025 | $2,180 | $211,914 | $105,465 | $106,449 |
| 2024 | $2,155 | $207,760 | $103,398 | $104,362 |
| 2023 | $2,155 | $203,687 | $101,371 | $102,316 |
| 2022 | $2,122 | $199,694 | $99,384 | $100,310 |
| 2021 | $2,118 | $195,780 | $97,436 | $98,344 |
| 2020 | $2,094 | $193,773 | $96,437 | $97,336 |
| 2019 | $2,081 | $189,975 | $94,547 | $95,428 |
| 2018 | $2,057 | $186,251 | $92,694 | $93,557 |
| 2017 | $2,018 | $182,600 | $90,877 | $91,723 |
| 2016 | $1,903 | $179,021 | $89,096 | $89,925 |
| 2015 | $1,876 | $176,333 | $87,758 | $88,575 |
| 2014 | $1,806 | $172,879 | $86,039 | $86,840 |
Source: Public Records
Map
Nearby Homes
- 0 S Burton St
- 90111003 W Price St
- 1 W Branch St
- 189 E Tefft St
- 150 E Chestnut St
- 285 E Tefft St
- 449 W Tefft St Unit 23
- 449 W Tefft St Unit 13
- 400 N Oakglen Ave
- 412 N Mallagh St
- 160 San Antonio Ln
- 525 Grande Ave Unit D
- 450 Avenida de Socios Unit 12
- 368 Avenida de Amigos
- 424 Bermuda Place
- 626 Juno Ct
- Mesa Plan at Hill Street Terraces - Hill Street Series
- Pacific Plan at Hill Street Terraces - Hill Street Series
- Monarch Plan at Hill Street Terraces - Hill Street Series
- Rancho Plan at Hill Street Terraces - Hill Street Series
- 112 W Price St
- 192194 W Price St
- 144 W Price St
- 162 Old Town Ct
- 168 Old Town Ct
- 162 Old Town Ct
- 174 Old Town Ct
- 190 S Thompson Ave Unit A
- 190 S Thompson Ave
- 180 Old Town Ct
- 109 W Price St
- 170 S Thompson Ave
- 113 W Price St
- 186 Old Town Ct
- 105 W Price St
- 200 S Burton St
- 131 W Dana St
- 131 W Dana St Unit B
- 131 W Dana St Unit 101
- 101 W Price St