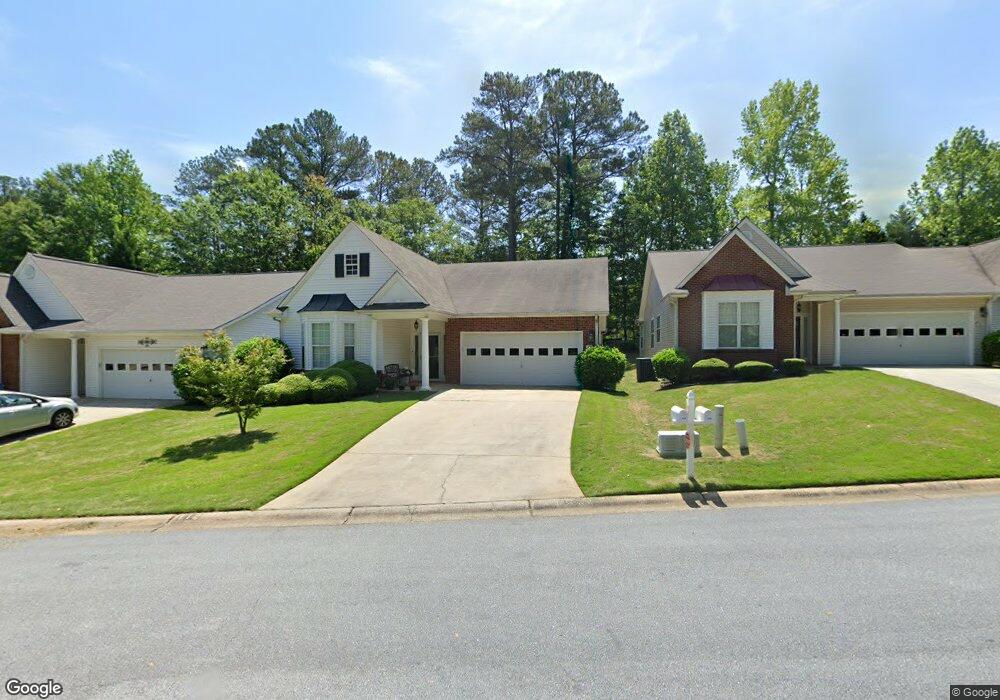
112 Willow Creek Dr Peachtree City, GA 30269
Estimated Value: $446,975 - $494,000
3
Beds
2
Baths
2,023
Sq Ft
$236/Sq Ft
Est. Value
About This Home
This home is located at 112 Willow Creek Dr, Peachtree City, GA 30269 and is currently estimated at $477,994, approximately $236 per square foot. 112 Willow Creek Dr is a home located in Fayette County with nearby schools including Huddleston Elementary School, Booth Middle School, and McIntosh High School.
Ownership History
Date
Name
Owned For
Owner Type
Purchase Details
Closed on
Apr 6, 2022
Sold by
Hollis Lilly L
Bought by
Baker Pamela Carolyn
Current Estimated Value
Home Financials for this Owner
Home Financials are based on the most recent Mortgage that was taken out on this home.
Original Mortgage
$395,760
Outstanding Balance
$373,347
Interest Rate
4.67%
Mortgage Type
New Conventional
Estimated Equity
$104,647
Purchase Details
Closed on
Aug 21, 2020
Sold by
Correll Dale J
Bought by
Hollis Lillie L
Purchase Details
Closed on
Apr 11, 2016
Sold by
Defrancisco Patricia Estate
Bought by
Brogdon James D and Brogdon Janet M
Purchase Details
Closed on
May 28, 1999
Sold by
Bob Adams Homes Inc
Bought by
Leeper Delores R
Home Financials for this Owner
Home Financials are based on the most recent Mortgage that was taken out on this home.
Original Mortgage
$128,000
Interest Rate
6.9%
Mortgage Type
New Conventional
Create a Home Valuation Report for This Property
The Home Valuation Report is an in-depth analysis detailing your home's value as well as a comparison with similar homes in the area
Home Values in the Area
Average Home Value in this Area
Purchase History
| Date | Buyer | Sale Price | Title Company |
|---|---|---|---|
| Baker Pamela Carolyn | $412,500 | None Listed On Document | |
| Hollis Lillie L | $315,250 | -- | |
| Brogdon James D | $254,000 | -- | |
| Leeper Delores R | $178,300 | -- |
Source: Public Records
Mortgage History
| Date | Status | Borrower | Loan Amount |
|---|---|---|---|
| Open | Baker Pamela Carolyn | $395,760 | |
| Previous Owner | Leeper Delores R | $128,000 |
Source: Public Records
Tax History Compared to Growth
Tax History
| Year | Tax Paid | Tax Assessment Tax Assessment Total Assessment is a certain percentage of the fair market value that is determined by local assessors to be the total taxable value of land and additions on the property. | Land | Improvement |
|---|---|---|---|---|
| 2024 | $3,042 | $162,648 | $26,000 | $136,648 |
| 2023 | $2,522 | $165,000 | $23,440 | $141,560 |
| 2022 | $3,670 | $146,040 | $26,000 | $120,040 |
| 2021 | $3,434 | $125,880 | $26,000 | $99,880 |
| 2020 | $1,342 | $127,300 | $17,100 | $110,200 |
| 2019 | $1,194 | $112,340 | $17,100 | $95,240 |
| 2018 | $1,146 | $106,140 | $17,100 | $89,040 |
| 2017 | $3,241 | $101,060 | $17,100 | $83,960 |
| 2016 | $3,193 | $95,900 | $17,100 | $78,800 |
| 2015 | $1,079 | $88,860 | $17,100 | $71,760 |
| 2014 | $2,740 | $82,700 | $17,100 | $65,600 |
| 2013 | -- | $81,940 | $0 | $0 |
Source: Public Records
Map
Nearby Homes
- 213 Cedar Dr
- 217 Hilltop Dr
- 444 Seabiscuit Walk Unit 55
- 442 Seabiscuit Walk
- 440 Seabiscuit Walk
- 164 Twiggs Corner
- 124 Hickory Dr
- 33 Twiggs Corner
- 0 Northlake Dr Unit 10270603
- 4 & 5 Northlake Cir
- 228 Terrane Ridge
- 445 Seabisuit Walk
- 319 Ruffian Cir Unit 71
- 313 Ruffian Cir Unit 74
- 317 Ruffian Cir Unit 72
- 321 Ruffian Cir Unit 70
- 244 Terrane Ridge
- 709 Cove Rd
- 115 Edgewater Way
- 107 Presidio Park
- 112 Willow Creek Dr Unit PEACHTREE CITY
- 114 Willow Creek Dr
- 110 Willow Creek Dr
- 0 Willow Creek Dr Unit 7478056
- 0 Willow Creek Dr Unit 7137901
- 0 Willow Creek Dr Unit 3243004
- 0 Willow Creek Dr Unit 8615566
- 0 Willow Creek Dr Unit 8588415
- 0 Willow Creek Dr Unit 8543851
- 0 Willow Creek Dr Unit 8008465
- 0 Willow Creek Dr Unit 7631608
- 0 Willow Creek Dr Unit 7589067
- 108 Willow Creek Dr
- 214 Cedar Dr
- 106 Willow Creek Dr
- 212 Cedar Dr
- 216 Cedar Dr
- 101 Willow Creek Dr
- 104 Willow Creek Dr
- 218 Cedar Dr