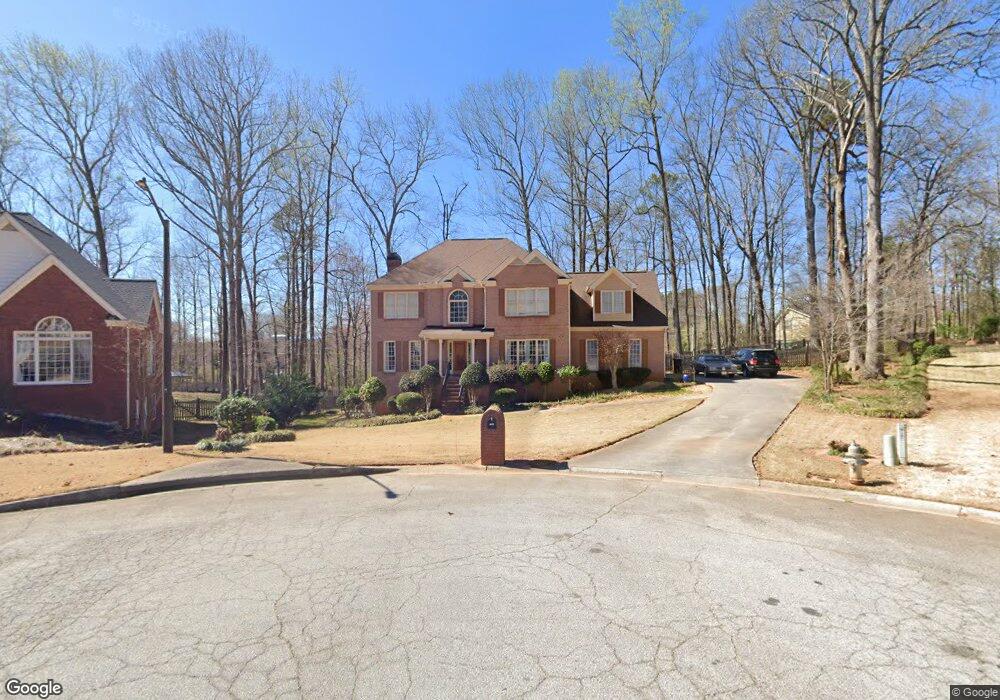
1120 Annie Ln SW Unit 2 Mableton, GA 30126
Estimated Value: $431,686 - $503,000
5
Beds
4
Baths
2,494
Sq Ft
$192/Sq Ft
Est. Value
About This Home
This home is located at 1120 Annie Ln SW Unit 2, Mableton, GA 30126 and is currently estimated at $478,422, approximately $191 per square foot. 1120 Annie Ln SW Unit 2 is a home located in Cobb County with nearby schools including Deerwood Elementary School, Mableton Elementary School, and Floyd Middle School.
Ownership History
Date
Name
Owned For
Owner Type
Purchase Details
Closed on
Dec 7, 2001
Sold by
Sewell David
Bought by
Sewell David and Sewell Pamela
Current Estimated Value
Home Financials for this Owner
Home Financials are based on the most recent Mortgage that was taken out on this home.
Original Mortgage
$28,300
Interest Rate
6.49%
Mortgage Type
New Conventional
Purchase Details
Closed on
Sep 20, 2001
Sold by
Sewell David
Bought by
Sewell David and Sewell Pamela
Home Financials for this Owner
Home Financials are based on the most recent Mortgage that was taken out on this home.
Original Mortgage
$226,400
Interest Rate
6.89%
Mortgage Type
New Conventional
Purchase Details
Closed on
Sep 22, 1995
Sold by
Live Oak Bldrs
Bought by
Sewell David Pamela
Create a Home Valuation Report for This Property
The Home Valuation Report is an in-depth analysis detailing your home's value as well as a comparison with similar homes in the area
Home Values in the Area
Average Home Value in this Area
Purchase History
| Date | Buyer | Sale Price | Title Company |
|---|---|---|---|
| Sewell David | -- | -- | |
| Sewell David | -- | -- | |
| Sewell David | -- | -- | |
| Sewell David Pamela | $197,500 | -- |
Source: Public Records
Mortgage History
| Date | Status | Borrower | Loan Amount |
|---|---|---|---|
| Closed | Sewell David | $28,300 | |
| Previous Owner | Sewell David | $226,400 |
Source: Public Records
Tax History Compared to Growth
Tax History
| Year | Tax Paid | Tax Assessment Tax Assessment Total Assessment is a certain percentage of the fair market value that is determined by local assessors to be the total taxable value of land and additions on the property. | Land | Improvement |
|---|---|---|---|---|
| 2025 | $1,092 | $193,648 | $32,000 | $161,648 |
| 2024 | $4,530 | $193,648 | $32,000 | $161,648 |
| 2023 | $3,331 | $163,352 | $20,000 | $143,352 |
| 2022 | $3,904 | $163,352 | $20,000 | $143,352 |
| 2021 | $3,155 | $129,132 | $20,000 | $109,132 |
| 2020 | $2,787 | $112,324 | $20,000 | $92,324 |
| 2019 | $2,787 | $112,324 | $20,000 | $92,324 |
| 2018 | $2,787 | $112,324 | $20,000 | $92,324 |
| 2017 | $2,694 | $112,324 | $20,000 | $92,324 |
| 2016 | $2,439 | $100,536 | $20,000 | $80,536 |
| 2015 | $2,315 | $92,588 | $23,400 | $69,188 |
| 2014 | $2,331 | $92,588 | $0 | $0 |
Source: Public Records
Map
Nearby Homes
- 8009 Haven Springs Trace
- 8029 Haven Springs Trace
- 8025 Haven Springs Trace
- 8041 Haven Springs Trace
- 4690 Glore Rd SW
- 4556 Sweetlake Rd SW
- Linden Plan at Sweetlake Grove - Bungalow Series
- 971 Verlander Trail
- 4612 Springside Ct SW
- 960 Verlander Trail
- 1078 Hibiscus Way SW
- Kaufman Plan at Wilkins Walk
- Bryson Plan at Wilkins Walk
- Brooks Plan at Wilkins Walk
- 4589 Moray Dr
- 4561 Moray Dr
- 4593 Moray Dr
- 4585 Moray Dr
- 4557 Moray Dr
- 4577 Moray Dr
- 1122 Annie Ln SW
- 1119 Annie Ln SW Unit II
- 4603 Ethel Springs Trail SW
- 4605 Ethel Springs Trail SW
- 1126 Annie Ln SW
- 4601 Ethel Springs Trail SW
- 1124 Annie Ln SW
- 1121 Annie Ln SW
- 4677 Glore Rd SW Unit 2
- 4607 Ethel Springs Trail SW
- 1128 Annie Ln SW Unit II
- 0 Ethel Springs Trail Unit 7241220
- 0 Ethel Springs Trail
- 4600 Ethel Springs Trail SW
- 4667 Glore Rd SW
- 1130 Annie Ln SW
- 1123 Annie Ln SW
- 4602 Ethel Springs Trail SW
- 0 Annie Ln Unit 7287489
- 0 Annie Ln Unit 8825816