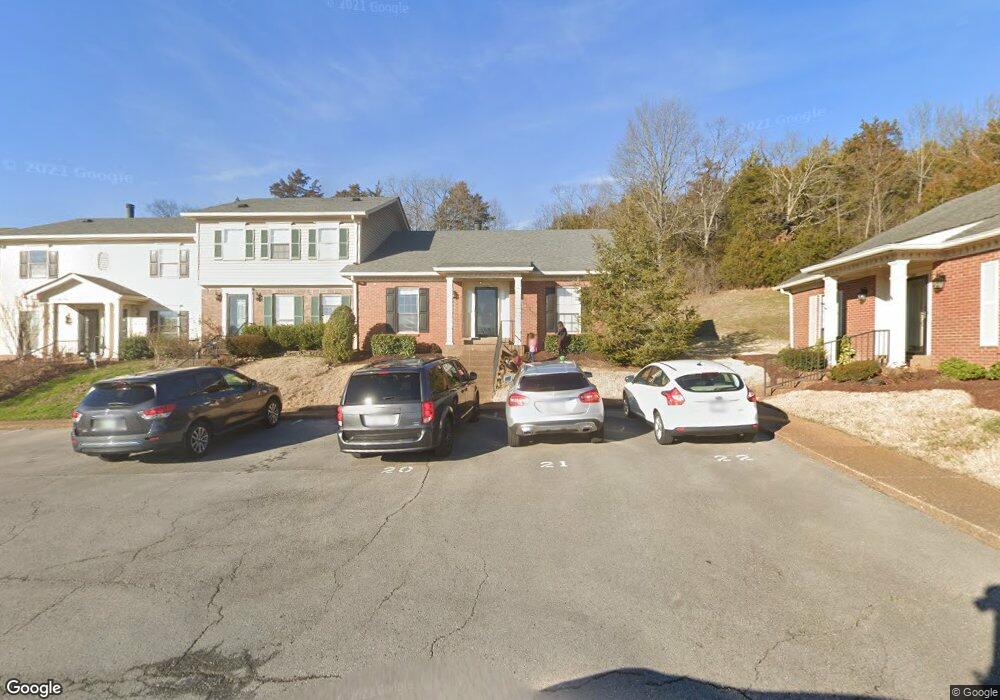
1120 Brentwood Point Unit 1120 Brentwood, TN 37027
Estimated Value: $480,000 - $514,000
4
Beds
2
Baths
2,067
Sq Ft
$242/Sq Ft
Est. Value
About This Home
This home is located at 1120 Brentwood Point Unit 1120, Brentwood, TN 37027 and is currently estimated at $500,716, approximately $242 per square foot. 1120 Brentwood Point Unit 1120 is a home located in Williamson County with nearby schools including Walnut Grove Elementary School, Grassland Middle School, and Franklin High School.
Ownership History
Date
Name
Owned For
Owner Type
Purchase Details
Closed on
Sep 25, 2020
Sold by
Moore Jacqueline
Bought by
Krieg Noah C and Krieg Lujun
Current Estimated Value
Home Financials for this Owner
Home Financials are based on the most recent Mortgage that was taken out on this home.
Original Mortgage
$288,000
Outstanding Balance
$256,161
Interest Rate
2.9%
Mortgage Type
New Conventional
Estimated Equity
$244,555
Purchase Details
Closed on
Jun 16, 2003
Sold by
Hyde Justice
Bought by
Moore Jacqueline
Purchase Details
Closed on
Jul 7, 2000
Sold by
Woods Bonez R Ward
Bought by
Hyde Justice
Home Financials for this Owner
Home Financials are based on the most recent Mortgage that was taken out on this home.
Original Mortgage
$70,000
Interest Rate
8.63%
Create a Home Valuation Report for This Property
The Home Valuation Report is an in-depth analysis detailing your home's value as well as a comparison with similar homes in the area
Home Values in the Area
Average Home Value in this Area
Purchase History
| Date | Buyer | Sale Price | Title Company |
|---|---|---|---|
| Krieg Noah C | $320,000 | Stewart Title Co Tennessee | |
| Krieg Noah C | $320,000 | Stewart Title | |
| Moore Jacqueline | $157,250 | -- | |
| Hyde Justice | $157,000 | -- |
Source: Public Records
Mortgage History
| Date | Status | Borrower | Loan Amount |
|---|---|---|---|
| Open | Krieg Noah C | $288,000 | |
| Closed | Krieg Noah C | $288,000 | |
| Previous Owner | Hyde Justice | $70,000 |
Source: Public Records
Tax History Compared to Growth
Tax History
| Year | Tax Paid | Tax Assessment Tax Assessment Total Assessment is a certain percentage of the fair market value that is determined by local assessors to be the total taxable value of land and additions on the property. | Land | Improvement |
|---|---|---|---|---|
| 2024 | $1,799 | $82,925 | $16,250 | $66,675 |
| 2023 | $1,799 | $82,925 | $16,250 | $66,675 |
| 2022 | $1,799 | $82,925 | $16,250 | $66,675 |
| 2021 | $1,799 | $82,925 | $16,250 | $66,675 |
| 2020 | $1,584 | $61,400 | $12,000 | $49,400 |
| 2019 | $1,584 | $61,400 | $12,000 | $49,400 |
| 2018 | $1,541 | $61,400 | $12,000 | $49,400 |
| 2017 | $1,529 | $61,400 | $12,000 | $49,400 |
| 2016 | $1,510 | $61,400 | $12,000 | $49,400 |
| 2015 | -- | $50,100 | $11,250 | $38,850 |
| 2014 | $220 | $50,100 | $11,250 | $38,850 |
Source: Public Records
Map
Nearby Homes
- 1123 Brentwood Point Unit 1123
- 1145 Brentwood Point Unit 1145
- 1007 Brentwood Point
- 921 Brentwood Point
- 302 Flowerwood Ct Unit 3A
- 702 Vineland Ct
- 1628 Vineland Dr
- 1655 Valle Verde Dr
- 1604 Rosewood Ct Unit 3
- 7024 Moores Ln
- 1600 Reed Dr
- 1612 Brentwood Pointe
- 1833 Brentwood Pointe
- 7036 Tartan Crest Ct
- 7038 Tartan Crest Ct Unit 55
- 1815 Brentwood Pointe
- 1535 Franklin Rd
- 9008 Sunrise Cir
- 7063 Sunrise Cir Unit 7063
- 1605 Franklin Rd
- 1120 Brentwood Point Unit 1120
- 1120 Brentwood Point
- 1119 Brentwood Point
- 1118 Brentwood Point Unit 1118
- 1118 Brentwood Pointe Ll Unit 118
- 1117 Brentwood Point
- 1121 Brentwood Point Unit 1121
- 1122 Brentwood Point Unit 1122
- 1122 Brentwood Pointe
- 1122 Brentwood Point
- 1123 Brentwood Point
- 1116 Brentwood Point Unit 1116
- 1115 Brentwood Point Unit 1115
- 1115 Brentwood Point
- 1115 Brentwood Point
- 1115 Brentwood Point
- 1124 Brentwood Point Unit 1124
- 1124 Brentwood Point
- 1114 Brentwood Point
- 1125 Brentwood Pointe