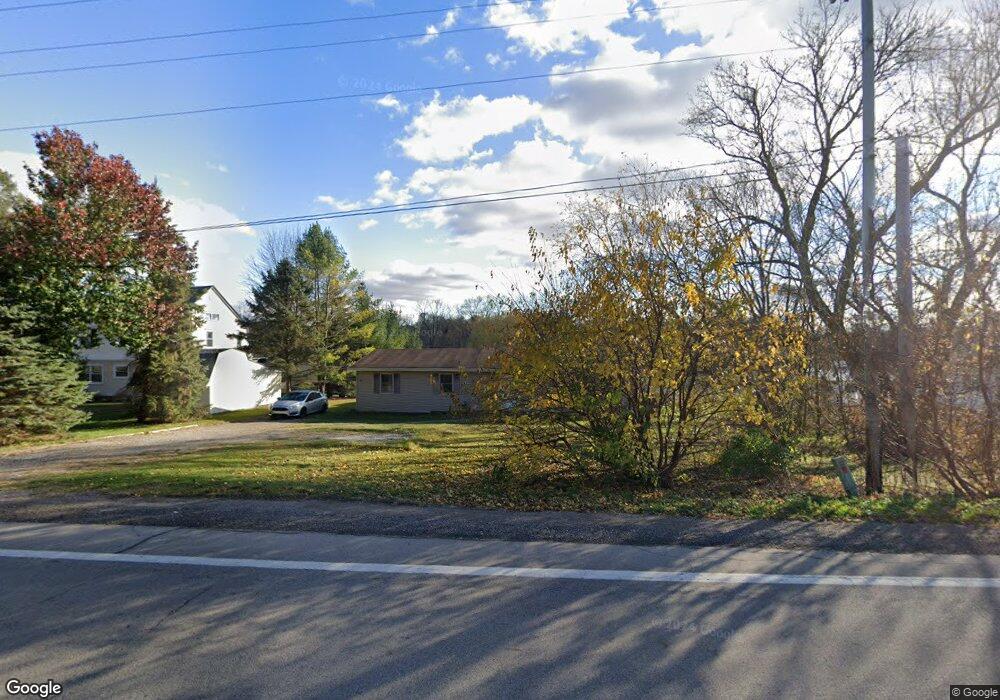
1120 E Main St Lowell, MI 49331
Estimated Value: $251,000 - $357,000
2
Beds
1
Bath
1,180
Sq Ft
$251/Sq Ft
Est. Value
About This Home
This home is located at 1120 E Main St, Lowell, MI 49331 and is currently estimated at $295,703, approximately $250 per square foot. 1120 E Main St is a home located in Kent County with nearby schools including Bushnell Elementary School, Cherry Creek Elementary School, and Lowell Middle School.
Ownership History
Date
Name
Owned For
Owner Type
Purchase Details
Closed on
Aug 27, 2008
Sold by
Jorgensen Eric A and Jorgensen Cassandra R
Bought by
Eldred Paul and Eldred Yumi
Current Estimated Value
Home Financials for this Owner
Home Financials are based on the most recent Mortgage that was taken out on this home.
Original Mortgage
$119,516
Outstanding Balance
$79,571
Interest Rate
6.54%
Mortgage Type
VA
Estimated Equity
$216,132
Purchase Details
Closed on
Feb 24, 1994
Bought by
Eldred Vriesenga and Eldred Paul
Create a Home Valuation Report for This Property
The Home Valuation Report is an in-depth analysis detailing your home's value as well as a comparison with similar homes in the area
Home Values in the Area
Average Home Value in this Area
Purchase History
| Date | Buyer | Sale Price | Title Company |
|---|---|---|---|
| Eldred Paul | $117,000 | Chicago Title | |
| Eldred Vriesenga | $59,000 | -- |
Source: Public Records
Mortgage History
| Date | Status | Borrower | Loan Amount |
|---|---|---|---|
| Open | Eldred Paul | $119,516 |
Source: Public Records
Tax History
| Year | Tax Paid | Tax Assessment Tax Assessment Total Assessment is a certain percentage of the fair market value that is determined by local assessors to be the total taxable value of land and additions on the property. | Land | Improvement |
|---|---|---|---|---|
| 2025 | $1,923 | $132,600 | $0 | $0 |
| 2024 | $19 | $95,300 | $0 | $0 |
| 2023 | $2,173 | $83,500 | $0 | $0 |
| 2022 | $2,085 | $73,300 | $0 | $0 |
| 2021 | $2,026 | $66,000 | $0 | $0 |
| 2020 | $1,680 | $63,600 | $0 | $0 |
| 2019 | $1,972 | $60,800 | $0 | $0 |
| 2018 | $1,930 | $60,600 | $0 | $0 |
| 2017 | $1,882 | $56,500 | $0 | $0 |
| 2016 | $1,830 | $45,700 | $0 | $0 |
| 2015 | -- | $45,700 | $0 | $0 |
| 2013 | -- | $39,900 | $0 | $0 |
Source: Public Records
Map
Nearby Homes
- 125 S Grove St
- 220 King St Unit 10
- 913 N Monroe St
- 1080 N Washington St SE
- 118 N Hudson St SE
- 418 Elm St SE
- 992 N Washington Rd SE
- 517 Elm St SE
- 1040 N Washington St
- 13940 Rolling Creek Dr
- 521 Spring St
- 13875 Rolling Creek Dr
- 1040 N Washington Rd
- 4343 S Montcalm Ave
- 780 Bowes Rd
- 4356 Amazon Dr
- 2348 Segwun Ave SE
- 13100 Grand River Dr SE
- 913 Clark St Unit 7
- 4549 Amazon Dr
- 1126 E Main St
- 1106 E Main St
- 1030 E Main St
- 1022 E Main St
- 1115 E Main St
- 1012 E Main St
- 1019 E Main St
- 1019 E Main St Unit B C D
- 1019 E Main St Unit D
- 1019 E Main St Unit C
- 1019 E Main St Unit B
- 1019 E Main St Unit A
- 1132 E Main St
- 1001 Railroad St
- 1155 E Main St
- 920 High St SE
- 113 James St
- 1242 E Main St
- 125 James St
- 926 E Main St
Your Personal Tour Guide
Ask me questions while you tour the home.