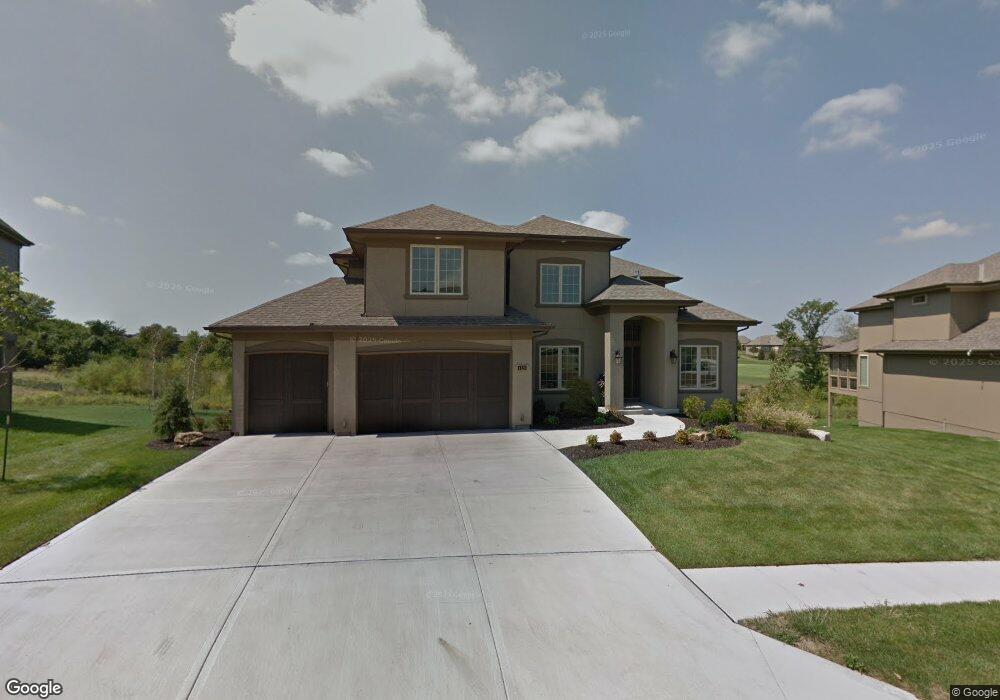
1120 Metfield Ln Raymore, MO 64083
Estimated Value: $592,255 - $664,000
5
Beds
4
Baths
3,026
Sq Ft
$207/Sq Ft
Est. Value
About This Home
This home is located at 1120 Metfield Ln, Raymore, MO 64083 and is currently estimated at $625,314, approximately $206 per square foot. 1120 Metfield Ln is a home located in Cass County with nearby schools including Creekmoor Elementary School, Raymore-Peculiar East Middle School, and Raymore-Peculiar Senior High School.
Ownership History
Date
Name
Owned For
Owner Type
Purchase Details
Closed on
Mar 6, 2015
Sold by
Cooper Land Development Inc
Bought by
C & M Mullin Road
Current Estimated Value
Purchase Details
Closed on
Oct 27, 2010
Sold by
C And M Builders Inc
Bought by
Kiger Troy D and Kiger Ann K
Purchase Details
Closed on
Mar 15, 2010
Sold by
Cooper Land Development Inc
Bought by
C And M Builders Inc
Home Financials for this Owner
Home Financials are based on the most recent Mortgage that was taken out on this home.
Original Mortgage
$54,120
Interest Rate
4.93%
Mortgage Type
Future Advance Clause Open End Mortgage
Create a Home Valuation Report for This Property
The Home Valuation Report is an in-depth analysis detailing your home's value as well as a comparison with similar homes in the area
Home Values in the Area
Average Home Value in this Area
Purchase History
| Date | Buyer | Sale Price | Title Company |
|---|---|---|---|
| C & M Mullin Road | -- | None Available | |
| Kiger Troy D | -- | -- | |
| C And M Builders Inc | -- | -- |
Source: Public Records
Mortgage History
| Date | Status | Borrower | Loan Amount |
|---|---|---|---|
| Previous Owner | C And M Builders Inc | $54,120 |
Source: Public Records
Tax History Compared to Growth
Tax History
| Year | Tax Paid | Tax Assessment Tax Assessment Total Assessment is a certain percentage of the fair market value that is determined by local assessors to be the total taxable value of land and additions on the property. | Land | Improvement |
|---|---|---|---|---|
| 2025 | $6,744 | $93,260 | $13,090 | $80,170 |
| 2024 | $6,744 | $82,870 | $11,900 | $70,970 |
| 2023 | $6,735 | $82,870 | $11,900 | $70,970 |
| 2022 | $5,919 | $72,350 | $11,900 | $60,450 |
| 2021 | $5,920 | $72,350 | $11,900 | $60,450 |
| 2020 | $5,992 | $71,930 | $11,900 | $60,030 |
| 2019 | $5,784 | $71,930 | $11,900 | $60,030 |
| 2018 | $5,756 | $69,120 | $11,900 | $57,220 |
| 2017 | $5,282 | $69,120 | $11,900 | $57,220 |
| 2016 | $5,282 | $65,840 | $11,900 | $53,940 |
| 2015 | $5,286 | $65,840 | $11,900 | $53,940 |
| 2014 | $5,288 | $65,840 | $11,900 | $53,940 |
| 2013 | -- | $65,840 | $11,900 | $53,940 |
Source: Public Records
Map
Nearby Homes
- 1415 Lewis Cir
- 1214 Cothran Ct
- 512 Turnbridge Dr
- 1225 Kingsland Cir
- 1208 Becket Ct
- 778 Creekmoor Dr
- 1363 Brompton Ln
- 1214 High Ridge Ct
- 707 Hampstead Dr
- 1303 Cross Creek Dr
- 819 Bridgeshire Dr
- 806 Creekmoor Pond Ln
- 821 Bridgeshire Dr
- 933 Bridgeshire Dr
- 773 Creekmoor Dr
- 901 Reed Dr
- 838 Reed Dr
- 1000 Vera Dr
- 827 Reed Dr
- 903 Reed Dr
- 1118 Metfield Ln
- 1122 Metfield Ln
- 1116 Metfield Ln
- 1124 Metfield Ln
- 1123 Metfield Ln
- 1115 Metfield Ln
- 1126 Metfield Ln
- 1114 Metfield Ln
- 1113 Metfield Ln
- 1200 Metfield Ln
- 1112 Metfield Ln
- 1207 Brunswick Ln
- 1210 Brunswick Ln
- 1208 Brunswick Ln
- 1111 Metfield Ln
- 1202 Metfield Ln
- 1205 Brunswick Ln
- 1206 Brunswick Ln
- 1204 Brunswick Ln
- 1109 Metfield Ln