
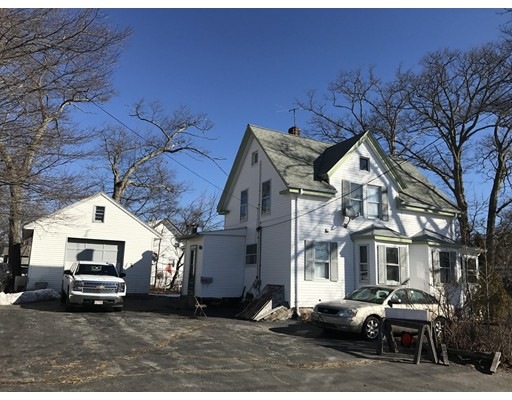

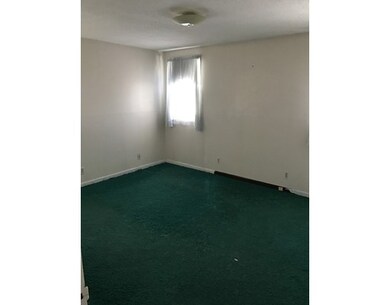
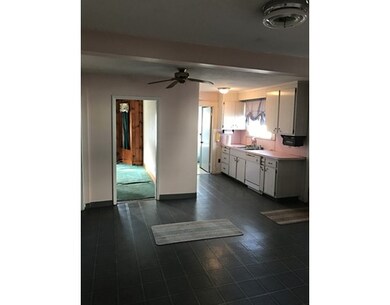
1120 N Main St Randolph, MA 02368
North Randolph Neighborhood
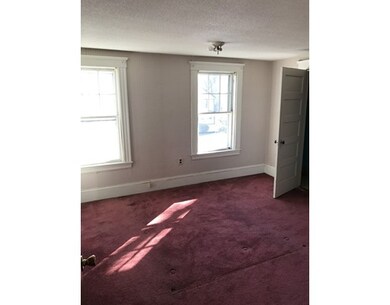
4
Beds
2
Baths
1,498
Sq Ft
10,019
Sq Ft Lot
About This Home
As of February 2018Contractors, Investors, 203k rehab buyers take note!! Needs very little to be in move in condition, likely will not qualify for FHA as one bathroom is in need of repairs. Appears zoning may allow for a business to be run out of the garage. Very easy to show, seller says make an offer!
Ownership History
Date
Name
Owned For
Owner Type
Purchase Details
Closed on
May 10, 2022
Sold by
Leger Osvaldo and Diaz Lovelis
Bought by
Leger Osvaldo and Denoly Dayomi S
Total Days on Market
13
Current Estimated Value
Purchase Details
Listed on
Nov 30, 2017
Closed on
Feb 26, 2018
Sold by
Trans Investments Llc
Bought by
Leger Osvaldo and Diaz Lovelis
Seller's Agent
Gigi Nguyen
Harmony Hill Realty LLC
Buyer's Agent
Eligia McKenna
McRae Realty Group
List Price
$399,999
Sold Price
$425,000
Premium/Discount to List
$25,001
6.25%
Home Financials for this Owner
Home Financials are based on the most recent Mortgage that was taken out on this home.
Avg. Annual Appreciation
5.96%
Original Mortgage
$401,912
Interest Rate
4.37%
Mortgage Type
FHA
Purchase Details
Listed on
Apr 6, 2017
Closed on
May 11, 2017
Sold by
Hartford Estelle A
Bought by
Trans Investments Llc
Seller's Agent
Boaz McMahon
Blue Fin Realty
Buyer's Agent
Rebecca Huang
East West Real Estate, LLC
List Price
$259,999
Sold Price
$245,000
Premium/Discount to List
-$14,999
-5.77%
Home Financials for this Owner
Home Financials are based on the most recent Mortgage that was taken out on this home.
Avg. Annual Appreciation
100.82%
Similar Home in Randolph, MA
Create a Home Valuation Report for This Property
The Home Valuation Report is an in-depth analysis detailing your home's value as well as a comparison with similar homes in the area
Home Values in the Area
Average Home Value in this Area
Purchase History
| Date | Type | Sale Price | Title Company |
|---|---|---|---|
| Quit Claim Deed | -- | None Available | |
| Not Resolvable | $425,000 | -- | |
| Not Resolvable | $245,000 | -- |
Source: Public Records
Mortgage History
| Date | Status | Loan Amount | Loan Type |
|---|---|---|---|
| Open | $516,890 | FHA | |
| Previous Owner | $401,912 | FHA | |
| Previous Owner | $150,000 | No Value Available |
Source: Public Records
Property History
| Date | Event | Price | Change | Sq Ft Price |
|---|---|---|---|---|
| 02/26/2018 02/26/18 | Sold | $425,000 | +6.3% | $232 / Sq Ft |
| 12/11/2017 12/11/17 | Pending | -- | -- | -- |
| 11/30/2017 11/30/17 | For Sale | $399,999 | +63.3% | $219 / Sq Ft |
| 05/12/2017 05/12/17 | Sold | $245,000 | -5.8% | $164 / Sq Ft |
| 04/19/2017 04/19/17 | Pending | -- | -- | -- |
| 04/06/2017 04/06/17 | For Sale | $259,999 | -- | $174 / Sq Ft |
Source: MLS Property Information Network (MLS PIN)
Tax History Compared to Growth
Tax History
| Year | Tax Paid | Tax Assessment Tax Assessment Total Assessment is a certain percentage of the fair market value that is determined by local assessors to be the total taxable value of land and additions on the property. | Land | Improvement |
|---|---|---|---|---|
| 2025 | $6,943 | $598,000 | $221,800 | $376,200 |
| 2024 | $6,835 | $596,900 | $217,500 | $379,400 |
| 2023 | $6,338 | $524,700 | $197,700 | $327,000 |
| 2022 | $6,234 | $458,400 | $164,700 | $293,700 |
| 2021 | $5,965 | $403,600 | $137,300 | $266,300 |
| 2020 | $5,283 | $354,300 | $137,300 | $217,000 |
| 2019 | $4,470 | $298,400 | $130,800 | $167,600 |
| 2018 | $4,249 | $267,600 | $118,800 | $148,800 |
| 2017 | $4,202 | $259,700 | $110,900 | $148,800 |
| 2016 | $4,066 | $233,800 | $100,800 | $133,000 |
| 2015 | $3,995 | $220,700 | $96,000 | $124,700 |
Source: Public Records
Agents Affiliated with this Home
-
Gigi Nguyen
Seller's Agent in 2018
Gigi Nguyen
Harmony Hill Realty LLC
(617) 326-8888
3 in this area
24 Total Sales
-
Buyer's Agent in 2018
Eligia McKenna
McRae Realty Group
-
Boaz McMahon
Seller's Agent in 2017
Boaz McMahon
Blue Fin Realty
(508) 510-2318
1 in this area
26 Total Sales
-
Rebecca Huang
Buyer's Agent in 2017
Rebecca Huang
East West Real Estate, LLC
(617) 888-0018
5 in this area
288 Total Sales
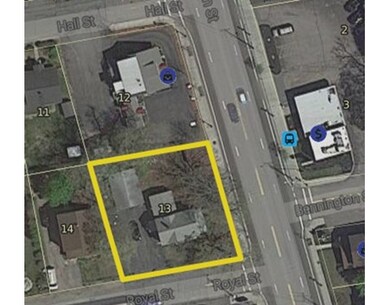
Map
Source: MLS Property Information Network (MLS PIN)
MLS Number: 72142032
APN: RAND-000006-Q000000-013106
Disclaimer: Certain information contained herein is derived from information provided by parties other than Homes.com. All information provided is deemed reliable, but is not guaranteed to be accurate and should be independently verified.
![]() The property listing data and information, or the Images, set forth herein were provided to MLS Property Information Network, Inc. from third party sources, including sellers, lessors and public records, and were compiled by MLS Property Information Network, Inc. The property listing data and information, and the Images, are for the personal, non-commercial use of consumers having a good faith interest in purchasing or leasing listed properties of the type displayed to them and may not be used for any purpose other than to identify prospective properties which such consumers may have a good faith interest in purchasing or leasing. MLS Property Information Network, Inc. and its subscribers disclaim any and all representations and warranties as to the accuracy of the property listing data and information, or as to the accuracy of any of the Images, set forth herein.
The property listing data and information, or the Images, set forth herein were provided to MLS Property Information Network, Inc. from third party sources, including sellers, lessors and public records, and were compiled by MLS Property Information Network, Inc. The property listing data and information, and the Images, are for the personal, non-commercial use of consumers having a good faith interest in purchasing or leasing listed properties of the type displayed to them and may not be used for any purpose other than to identify prospective properties which such consumers may have a good faith interest in purchasing or leasing. MLS Property Information Network, Inc. and its subscribers disclaim any and all representations and warranties as to the accuracy of the property listing data and information, or as to the accuracy of any of the Images, set forth herein.
Nearby Homes