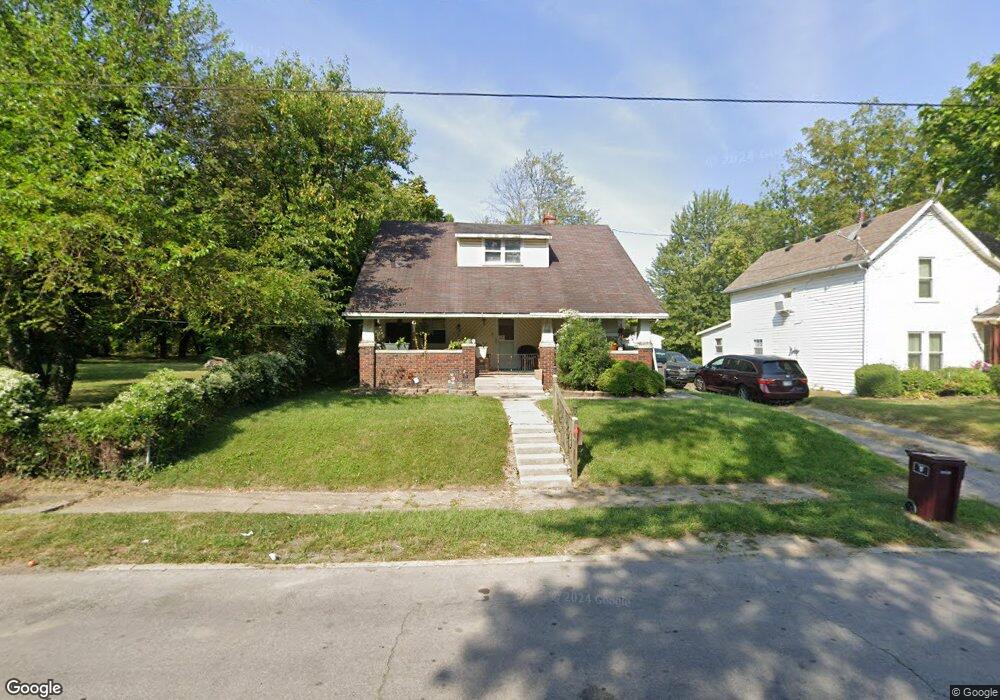
1120 S Central Ave Lima, OH 45804
Southside Lima NeighborhoodEstimated Value: $60,000 - $72,000
3
Beds
1
Bath
1,404
Sq Ft
$48/Sq Ft
Est. Value
About This Home
This home is located at 1120 S Central Ave, Lima, OH 45804 and is currently estimated at $67,435, approximately $48 per square foot. 1120 S Central Ave is a home located in Allen County with nearby schools including Unity Elementary School, Lima North Middle School, and Lima West Middle School.
Ownership History
Date
Name
Owned For
Owner Type
Purchase Details
Closed on
Jan 31, 2005
Sold by
United Midwest Savings Bank and Pulfer Thomas W
Bought by
White Timothy
Current Estimated Value
Home Financials for this Owner
Home Financials are based on the most recent Mortgage that was taken out on this home.
Original Mortgage
$25,000
Outstanding Balance
$15,366
Interest Rate
9.1%
Mortgage Type
Adjustable Rate Mortgage/ARM
Estimated Equity
$52,069
Purchase Details
Closed on
Sep 1, 1979
Bought by
Henderson Phillip S
Create a Home Valuation Report for This Property
The Home Valuation Report is an in-depth analysis detailing your home's value as well as a comparison with similar homes in the area
Home Values in the Area
Average Home Value in this Area
Purchase History
| Date | Buyer | Sale Price | Title Company |
|---|---|---|---|
| White Timothy | $25,000 | None Available | |
| Henderson Phillip S | $15,000 | -- |
Source: Public Records
Mortgage History
| Date | Status | Borrower | Loan Amount |
|---|---|---|---|
| Open | White Timothy | $25,000 |
Source: Public Records
Tax History
| Year | Tax Paid | Tax Assessment Tax Assessment Total Assessment is a certain percentage of the fair market value that is determined by local assessors to be the total taxable value of land and additions on the property. | Land | Improvement |
|---|---|---|---|---|
| 2024 | $547 | $13,690 | $1,440 | $12,250 |
| 2023 | $589 | $13,030 | $1,370 | $11,660 |
| 2022 | $591 | $13,030 | $1,370 | $11,660 |
| 2021 | $625 | $13,030 | $1,370 | $11,660 |
| 2020 | $563 | $10,570 | $1,330 | $9,240 |
| 2019 | $563 | $10,570 | $1,330 | $9,240 |
| 2018 | $575 | $10,570 | $1,330 | $9,240 |
| 2017 | $579 | $10,570 | $1,330 | $9,240 |
| 2016 | $587 | $10,570 | $1,330 | $9,240 |
| 2015 | $617 | $10,570 | $1,330 | $9,240 |
| 2014 | $617 | $11,030 | $1,400 | $9,630 |
| 2013 | $602 | $11,030 | $1,400 | $9,630 |
Source: Public Records
Map
Nearby Homes
- 1114 S Central Ave
- 1126 S Central Ave
- 1130 S Central Ave
- 1110 S Central Ave
- 220 E 2nd St
- 1123 S Union St
- 1109 S Union St
- 228 E 2nd St
- 1136 S Central Ave
- 1127 S Union St
- 230 E 2nd St
- 1111 S Union St
- 1129 S Union St
- 214 E 2nd St
- 1119 S Central Ave
- 300 E 2nd St
- 1115 S Central Ave
- 1127 S Central Ave
- 1142 S Central Ave
- 304 E 2nd St
Your Personal Tour Guide
Ask me questions while you tour the home.