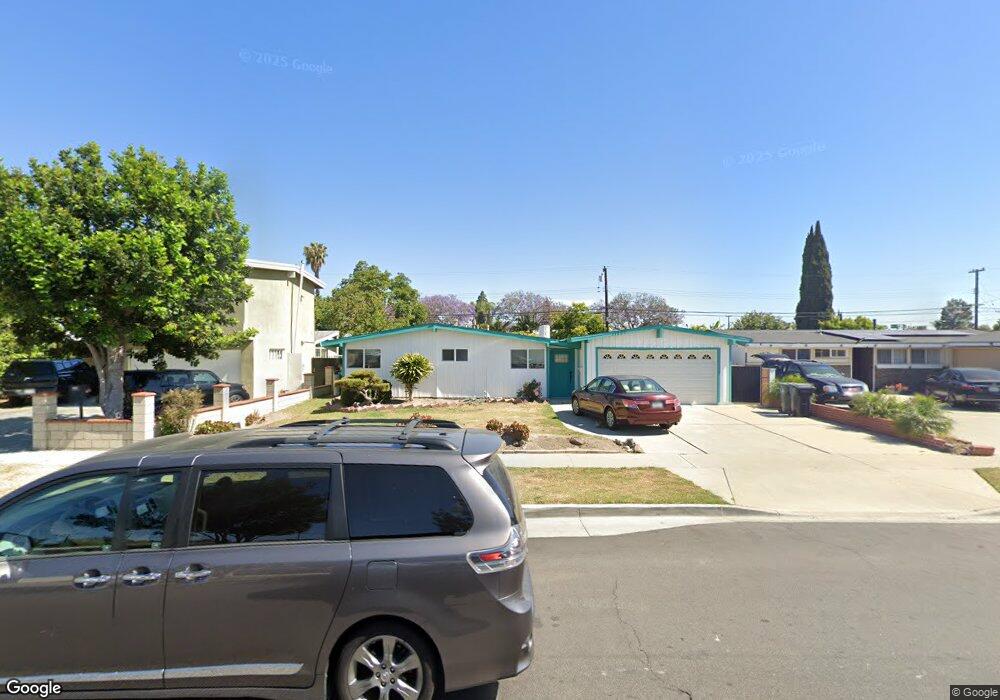
11201 Anabel Ave Garden Grove, CA 92843
Estimated Value: $910,080 - $1,165,000
3
Beds
2
Baths
1,274
Sq Ft
$777/Sq Ft
Est. Value
About This Home
This home is located at 11201 Anabel Ave, Garden Grove, CA 92843 and is currently estimated at $990,520, approximately $777 per square foot. 11201 Anabel Ave is a home located in Orange County with nearby schools including Woodbury Elementary School, James Irvine Intermediate School, and Bolsa Grande High School.
Ownership History
Date
Name
Owned For
Owner Type
Purchase Details
Closed on
Nov 1, 2021
Sold by
Truong Lilian Dac Phuc
Bought by
Lilian Dac Phuc Truong Living Trust
Current Estimated Value
Purchase Details
Closed on
Jun 30, 2012
Sold by
Truong Lilian Dac Phuc
Bought by
Truong Lilian Dac Phuc and Truong Lan Le
Purchase Details
Closed on
Aug 31, 2011
Sold by
Le Hoa Thoai
Bought by
Truong Lilian Dac Phuc
Purchase Details
Closed on
Oct 15, 2009
Sold by
Le Hoa Thai and Le Hoa Thoai
Bought by
Truong Lilian Dac Phuc and Le Hoa Thoai
Purchase Details
Closed on
Feb 11, 2000
Sold by
Lu Huang Hua Fang and Chang Hwa Fen Huang
Bought by
Le Son T and Le Hoa T
Purchase Details
Closed on
Sep 10, 1998
Sold by
Thoai Le Hoa and Thai Hoa Thai
Bought by
Le Hoa Thai and Truong Lan Le
Purchase Details
Closed on
Jul 17, 1998
Sold by
Thai Le Son and Thai Thoai Hoa
Bought by
Le Hoa Thai and Le Hoa Thoai
Purchase Details
Closed on
Feb 26, 1993
Sold by
Truong Lan Le
Bought by
Le Son Thai and Le Hoa Thoai
Create a Home Valuation Report for This Property
The Home Valuation Report is an in-depth analysis detailing your home's value as well as a comparison with similar homes in the area
Home Values in the Area
Average Home Value in this Area
Purchase History
| Date | Buyer | Sale Price | Title Company |
|---|---|---|---|
| Lilian Dac Phuc Truong Living Trust | -- | -- | |
| Truong Lilian Dac Phuc | -- | None Available | |
| Truong Lilian Dac Phuc | -- | None Available | |
| Truong Lilian Dac Phuc | -- | None Available | |
| Le Son T | $200,000 | Fidelity National Title Co | |
| Le Hoa Thai | -- | -- | |
| Le Hoa Thai | -- | -- | |
| Le Son Thai | -- | -- |
Source: Public Records
Tax History Compared to Growth
Tax History
| Year | Tax Paid | Tax Assessment Tax Assessment Total Assessment is a certain percentage of the fair market value that is determined by local assessors to be the total taxable value of land and additions on the property. | Land | Improvement |
|---|---|---|---|---|
| 2025 | $3,984 | $310,534 | $247,668 | $62,866 |
| 2024 | $3,984 | $304,446 | $242,812 | $61,634 |
| 2023 | $6,224 | $492,077 | $434,798 | $57,279 |
| 2022 | $3,819 | $292,625 | $233,383 | $59,242 |
| 2021 | $3,765 | $286,888 | $228,807 | $58,081 |
| 2020 | $3,720 | $283,947 | $226,461 | $57,486 |
| 2019 | $3,670 | $278,380 | $222,021 | $56,359 |
| 2018 | $3,581 | $272,922 | $217,668 | $55,254 |
| 2017 | $3,542 | $267,571 | $213,400 | $54,171 |
| 2016 | $3,370 | $262,325 | $209,216 | $53,109 |
| 2015 | $3,325 | $258,385 | $206,073 | $52,312 |
| 2014 | $3,247 | $253,324 | $202,036 | $51,288 |
Source: Public Records
Map
Nearby Homes
- 11321 Parkgreen Ln Unit 102
- 1609 N Parsons Place
- 10866 Westminster Ave Unit 10
- 10866 Westminster Ave Unit 1
- 5010 W Maurie Ave
- 13312 Michael Rainford Cir
- 13322 Euclid St
- 13372 Jessica Dr
- 14151 Lake St
- 1114 N Gates St
- 14356 Taft St
- 4213 Fay Cir
- 12970 Newhope St
- 1416 N Harbor Blvd Unit 6
- 13052 Rockinghorse Rd
- 526 W Tribella Ct
- 10422 Bonnie Dr
- 10391 Mildred Ave
- 12851 Newhope St
- 12152 Trask Ave Unit 29
- 11221 Anabel Ave
- 11191 Anabel Ave
- 11181 Anabel Ave
- 11231 Anabel Ave
- 11212 Woodbury Rd
- 11222 Woodbury Rd
- 11192 Woodbury Rd
- 11232 Woodbury Rd
- 11182 Woodbury Rd
- 11241 Anabel Ave
- 11202 Anabel Ave
- 11242 Woodbury Rd
- 11192 Anabel Ave
- 11222 Anabel Ave
- 11172 Woodbury Rd
- 11232 Anabel Ave
- 13731 Libby Ln
- 11251 Anabel Ave
- 11242 Anabel Ave
- 13721 Libby Ln