
11201 Lynbrook Dr Unit 3702 Houston, TX 77042
Briar Forest NeighborhoodEstimated payment $1,167/month
Highlights
- Views to the North
- Deck
- Community Pool
- Clubhouse
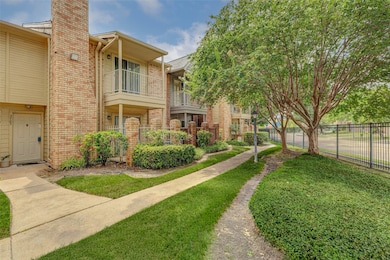
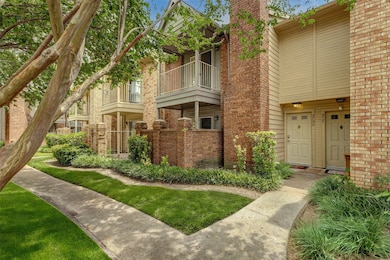
- Traditional Architecture
- Fenced Yard
About This Home
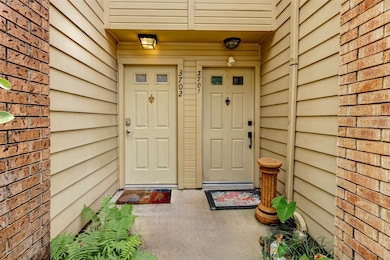
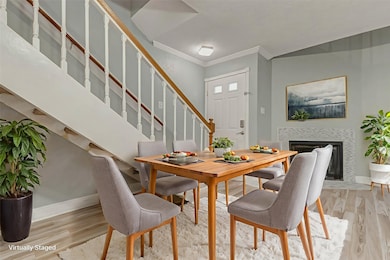
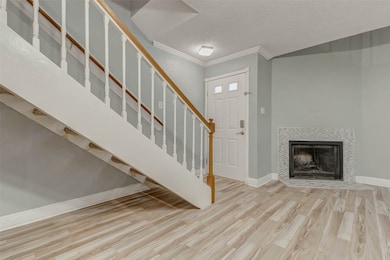
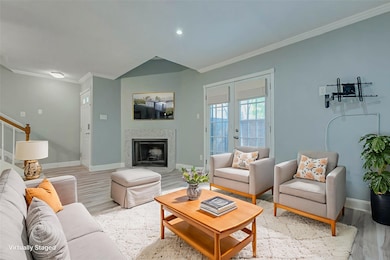
Discover comfort and convenience in this beautifully maintained 1-bedroom, 1.5-bath condo located in the community of Lynbrook Manor. This two-story unit features updated flooring on the first floor, a spacious living room with a cozy fireplace, and a guest-friendly half bath. The kitchen opens seamlessly to the dining area-perfect for everyday living and entertaining. Upstairs, the expansive primary suite boasts two walk-in closets and a private en-suite bath. Enjoy outdoor relaxation on the fenced patio and the ease of assigned covered parking. Additional updates include the washer and dryer (2025), dishwasher (2025), A/C (2023), and refrigerator (2021). Residents also benefit from access to multiple pools, meticulously landscaped grounds, and a prime location near the Energy Corridor, CityCentre, and major highways.
Listing Agent
CB&A, Realtors- Loop Central License #0820598 Listed on: 08/10/2025

Property Details
Home Type
- Condominium
Est. Annual Taxes
- $2,302
Year Built
- Built in 1983
Lot Details
- North Facing Home
- Fenced Yard
- Sprinkler System
HOA Fees
- $410 Monthly HOA Fees
Home Design
- Traditional Architecture
- Brick Exterior Construction
- Slab Foundation
- Composition Roof
- Wood Siding
Interior Spaces
- 893 Sq Ft Home
- 2-Story Property
- Wood Burning Fireplace
- Living Room
- Views to the North
Kitchen
- Electric Oven
- Electric Cooktop
- Dishwasher
Flooring
- Carpet
- Laminate
- Tile
Bedrooms and Bathrooms
- 1 Bedroom
- Bathtub with Shower
Laundry
- Laundry in Utility Room
- Dryer
- Washer
Parking
- 1 Detached Carport Space
- Additional Parking
- Assigned Parking
Outdoor Features
- Balcony
- Deck
- Patio
Schools
- Askew Elementary School
- Revere Middle School
- Westside High School
Utilities
- Central Heating and Cooling System
Community Details
Overview
- Association fees include common areas, maintenance structure, recreation facilities, sewer, trash, water
- Rise Management Association
- Lynbrook Manor Condo Subdivision
Amenities
- Clubhouse
Recreation
- Community Pool
Pet Policy
- The building has rules on how big a pet can be within a unit
Map
Home Values in the Area
Average Home Value in this Area
Tax History
| Year | Tax Paid | Tax Assessment Tax Assessment Total Assessment is a certain percentage of the fair market value that is determined by local assessors to be the total taxable value of land and additions on the property. | Land | Improvement |
|---|---|---|---|---|
| 2025 | $1,080 | $101,038 | $19,197 | $81,841 |
| 2024 | $1,080 | $116,353 | $22,107 | $94,246 |
| 2023 | $1,080 | $116,899 | $22,211 | $94,688 |
| 2022 | $2,002 | $95,377 | $18,122 | $77,255 |
| 2021 | $1,926 | $82,657 | $15,705 | $66,952 |
| 2020 | $1,992 | $82,657 | $15,705 | $66,952 |
| 2019 | $1,893 | $75,559 | $14,356 | $61,203 |
| 2018 | $1,082 | $67,997 | $12,919 | $55,078 |
| 2017 | $1,719 | $67,997 | $12,919 | $55,078 |
| 2016 | $1,719 | $67,997 | $12,919 | $55,078 |
| 2015 | $1,158 | $56,173 | $10,673 | $45,500 |
| 2014 | $1,158 | $45,033 | $8,556 | $36,477 |
Property History
| Date | Event | Price | List to Sale | Price per Sq Ft |
|---|---|---|---|---|
| 10/17/2025 10/17/25 | Price Changed | $107,000 | -4.5% | $120 / Sq Ft |
| 08/10/2025 08/10/25 | For Sale | $112,000 | -- | $125 / Sq Ft |
Purchase History
| Date | Type | Sale Price | Title Company |
|---|---|---|---|
| Vendors Lien | -- | None Available | |
| Warranty Deed | -- | None Available | |
| Vendors Lien | -- | Fidelity National Title | |
| Interfamily Deed Transfer | -- | -- |
Mortgage History
| Date | Status | Loan Amount | Loan Type |
|---|---|---|---|
| Open | $62,720 | New Conventional | |
| Previous Owner | $45,200 | Purchase Money Mortgage |
Source: Houston Association of REALTORS®
MLS Number: 69926059
APN: 1153410320002
Disclaimer: Certain information contained herein is derived from information provided by parties other than Homes.com. All information provided is deemed reliable, but is not guaranteed to be accurate and should be independently verified.
![]() Copyright 2025, Houston REALTORS® Information Service, Inc.
Copyright 2025, Houston REALTORS® Information Service, Inc.
The information provided is exclusively for consumers’ personal, non-commercial use, and may not be used for any purpose other than to identify prospective properties consumers may be interested in purchasing.
Information is deemed reliable but not guaranteed.
- 11201 Lynbrook Dr Unit 3202
- 11201 Lynbrook Dr Unit 3504
- 11201 Lynbrook Dr Unit 3823
- 11201 Lynbrook Dr Unit 3503
- 11201 Lynbrook Dr Unit 3703
- 1515 Sandy Springs Rd Unit 1808
- 1515 Sandy Springs Rd Unit 1102
- 1515 Sandy Springs Rd Unit 3003
- 1515 Sandy Springs Rd Unit 904
- 1515 Sandy Springs Rd Unit 3001
- 11206 Mattina Dr
- 1623 Cherry Ridge Dr
- 1506 Haven Lock Dr
- 11418 Long Pine Dr
- 11414 Cedar Creek Dr
- 11418 Lakeside Place Dr
- 11406 Briar Forest Dr
- 11203 Briar Forest Dr
- 1912 Hunters Trace St
- 1619 Fall Valley Dr
- 11206 Mattina Dr
- 1623 Cherry Ridge Dr
- 11250 Briar Forest Dr
- 1201 Wilcrest Dr
- 1622 Fall Valley Dr
- 1611 Prairie Mark Ln Unit 80
- 10834 Lynbrook Dr Unit B
- 10834 Sugar Hill Dr Unit a
- 1532 Prairie Grove Dr
- 11618 Lakeside Place Dr
- 642 Wilcrest Dr Unit 642
- 10826 Sugar Hill Dr Unit b
- 580 Wilcrest Dr Unit 580
- 10822 Lynbrook Dr Unit a
- 10827 Tupper Lake Dr
- 1917 Trixie Ln
- 2101 Hayes Rd Unit 1707
- 2101 Hayes Rd Unit 2002
- 2101 Hayes Rd Unit 516
- 2101 Hayes Rd Unit 1914