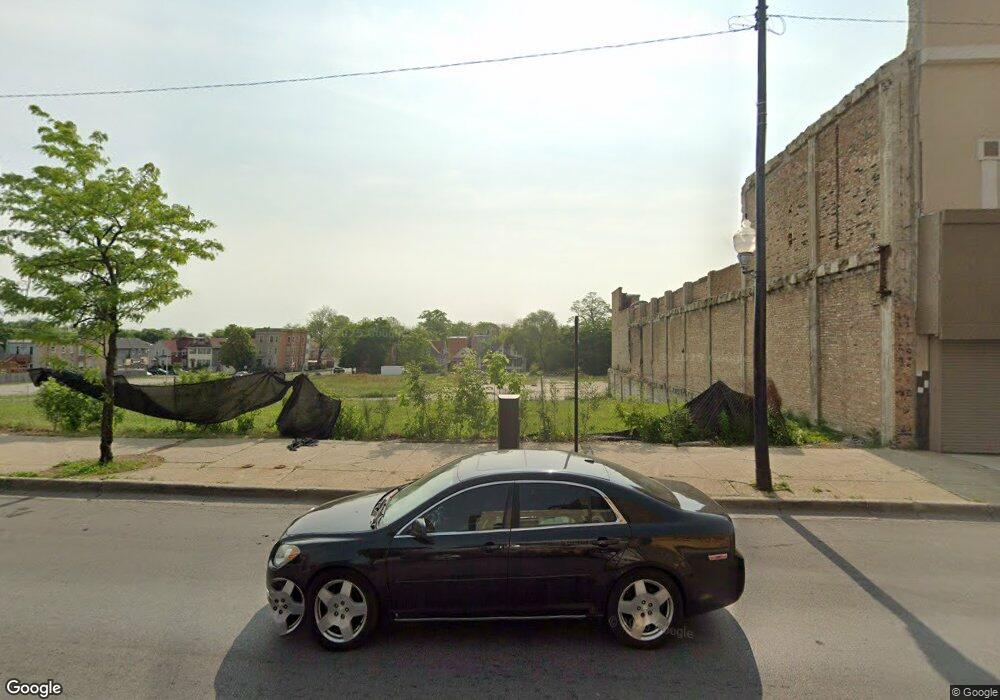
11201 S Michigan Ave Chicago, IL 60628
Roseland NeighborhoodEstimated Value: $258,000
--
Bed
--
Bath
--
Sq Ft
0.5
Acres
About This Home
This home is located at 11201 S Michigan Ave, Chicago, IL 60628 and is currently estimated at $258,000. 11201 S Michigan Ave is a home located in Cook County with nearby schools including Curtis Elementary School, Corliss High School, and CICS Prairie.
Ownership History
Date
Name
Owned For
Owner Type
Purchase Details
Closed on
Jul 26, 2024
Sold by
Judicial Sales Corporation
Bought by
City Of Chicago
Current Estimated Value
Purchase Details
Closed on
Dec 28, 2015
Sold by
Bbcn Bank
Bought by
Judicial Drive Property Holding Llc
Purchase Details
Closed on
Jan 26, 2015
Sold by
Lee Suk Ho
Bought by
Bbcn Bank
Purchase Details
Closed on
Aug 25, 2014
Sold by
Lee Hyung Sub and Lee Mee Sook
Bought by
Ho Kim Rachel Misuk and Ho Lee Suk
Purchase Details
Closed on
Mar 24, 2008
Sold by
Han Sang Pil
Bought by
Lee Hyung Sub
Purchase Details
Closed on
Feb 14, 2007
Sold by
Kwon John
Bought by
Kim Misuk
Purchase Details
Closed on
Jul 26, 2006
Sold by
Kang Won Hee and Kang Kum Ok
Bought by
Kim Rachel Misuk and Kwon John
Home Financials for this Owner
Home Financials are based on the most recent Mortgage that was taken out on this home.
Original Mortgage
$1,162,500
Interest Rate
7.25%
Mortgage Type
Commercial
Create a Home Valuation Report for This Property
The Home Valuation Report is an in-depth analysis detailing your home's value as well as a comparison with similar homes in the area
Home Values in the Area
Average Home Value in this Area
Purchase History
| Date | Buyer | Sale Price | Title Company |
|---|---|---|---|
| City Of Chicago | -- | None Listed On Document | |
| Judicial Drive Property Holding Llc | $350,000 | Attorney | |
| Bbcn Bank | -- | None Available | |
| Ho Kim Rachel Misuk | -- | First American Title Ins Co | |
| Lee Hyung Sub | $340,000 | First American Title Ins Co | |
| Kim Misuk | $387,500 | First American Title Ins Co | |
| Kim Rachel Misuk | $1,550,000 | St |
Source: Public Records
Mortgage History
| Date | Status | Borrower | Loan Amount |
|---|---|---|---|
| Previous Owner | Kim Rachel Misuk | $1,162,500 |
Source: Public Records
Tax History Compared to Growth
Tax History
| Year | Tax Paid | Tax Assessment Tax Assessment Total Assessment is a certain percentage of the fair market value that is determined by local assessors to be the total taxable value of land and additions on the property. | Land | Improvement |
|---|---|---|---|---|
| 2024 | $5,098 | $8,624 | $8,624 | -- |
| 2023 | $4,979 | $19,404 | $19,404 | -- |
| 2022 | $4,979 | $19,404 | $19,404 | $0 |
| 2021 | $4,790 | $19,404 | $19,404 | $0 |
| 2020 | $5,236 | $19,404 | $19,404 | $0 |
| 2019 | $23,448 | $97,222 | $48,510 | $48,712 |
| 2018 | $35,080 | $145,933 | $48,510 | $97,423 |
| 2017 | $35,504 | $133,970 | $40,425 | $93,545 |
| 2016 | $32,939 | $133,970 | $40,425 | $93,545 |
| 2015 | $29,815 | $133,970 | $40,425 | $93,545 |
| 2014 | $30,297 | $133,970 | $40,425 | $93,545 |
| 2013 | $29,668 | $133,502 | $40,425 | $93,077 |
Source: Public Records
Map
Nearby Homes
- 11241 S Michigan Ave
- 26 E 113th St
- 1 W 112th Place
- 11317 S Edbrooke Ave
- 6 W 111th Place
- 12551-53 S State St
- 118 W 113th Place
- 11000 S Michigan Ave
- 62 W 113th St
- 153 E 110th St
- 124 E 110th St
- 26 W 114th St
- 1 E 114th St
- 104 W 110th Place
- 11419 S Prairie Ave
- 10924 S Wabash Ave
- 11365 S Forest Ave
- 10916 S Wabash Ave
- 106 W 114th St
- 10910 S Edbrooke Ave
- 11205 S Michian Ave
- 11217 S Michigan Ave
- 11151 S Michigan Ave Unit 53
- 11151 S Michigan Ave
- 11221 S Michigan Ave
- 11221-27 S Michigan Ave
- 11200 S Michigan Ave
- 11206 S Michigan Ave
- 11210 S Michigan Ave
- 11212 S Michigan Ave
- 11145 S Michigan Ave
- 11152 S Michigan Ave
- 11216 S Michigan Ave
- 11148 S Edbrooke Ave
- 11148 S Edbrooke Ave
- 11150 S Michigan Ave
- 11234 S Edbrooke Ave
- 11234 S Edbrooke Ave
- 11144 S Edbrooke Ave
- 11140 S Edbrooke Ave