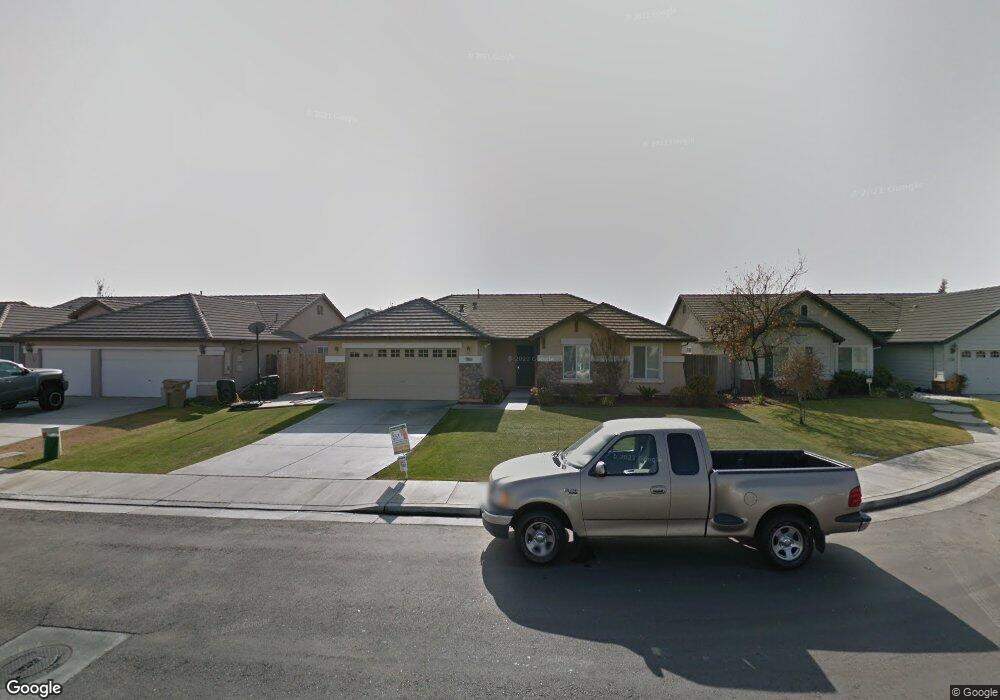
11203 Rancho Cordova St Bakersfield, CA 93311
Artisan NeighborhoodEstimated Value: $423,534 - $451,000
4
Beds
2
Baths
1,879
Sq Ft
$232/Sq Ft
Est. Value
About This Home
This home is located at 11203 Rancho Cordova St, Bakersfield, CA 93311 and is currently estimated at $436,384, approximately $232 per square foot. 11203 Rancho Cordova St is a home located in Kern County with nearby schools including Buena Vista Elementary School, Earl Warren Junior High School, and Independence High School.
Ownership History
Date
Name
Owned For
Owner Type
Purchase Details
Closed on
Nov 11, 2010
Sold by
Bella Vista Real Estate Holdings Llc
Bought by
Johnican Pearl D
Current Estimated Value
Home Financials for this Owner
Home Financials are based on the most recent Mortgage that was taken out on this home.
Original Mortgage
$133,920
Outstanding Balance
$88,088
Interest Rate
4.21%
Estimated Equity
$348,296
Purchase Details
Closed on
Aug 25, 2010
Sold by
Rincon Marco and Rincon Graciela
Bought by
Bella Vista Real Estate Holdings
Purchase Details
Closed on
Jul 31, 2003
Sold by
Centex Homes
Bought by
Rincon Marco and Rincon Graciela
Home Financials for this Owner
Home Financials are based on the most recent Mortgage that was taken out on this home.
Original Mortgage
$169,844
Interest Rate
5.62%
Create a Home Valuation Report for This Property
The Home Valuation Report is an in-depth analysis detailing your home's value as well as a comparison with similar homes in the area
Home Values in the Area
Average Home Value in this Area
Purchase History
| Date | Buyer | Sale Price | Title Company |
|---|---|---|---|
| Johnican Pearl D | $180,000 | Chicago Title Company | |
| Bella Vista Real Estate Holdings | -- | None Available | |
| Rincon Marco | $212,500 | Commerce Title |
Source: Public Records
Mortgage History
| Date | Status | Borrower | Loan Amount |
|---|---|---|---|
| Open | Johnican Pearl D | $133,920 | |
| Previous Owner | Rincon Marco | $169,844 | |
| Closed | Rincon Marco | $42,461 |
Source: Public Records
Tax History Compared to Growth
Tax History
| Year | Tax Paid | Tax Assessment Tax Assessment Total Assessment is a certain percentage of the fair market value that is determined by local assessors to be the total taxable value of land and additions on the property. | Land | Improvement |
|---|---|---|---|---|
| 2025 | $3,473 | $230,598 | $51,240 | $179,358 |
| 2024 | $3,415 | $226,078 | $50,236 | $175,842 |
| 2023 | $3,415 | $221,646 | $49,251 | $172,395 |
| 2022 | $3,280 | $217,301 | $48,286 | $169,015 |
| 2021 | $3,445 | $213,041 | $47,340 | $165,701 |
| 2020 | $3,441 | $210,857 | $46,855 | $164,002 |
| 2019 | $3,360 | $210,857 | $46,855 | $164,002 |
| 2018 | $3,241 | $202,672 | $45,037 | $157,635 |
| 2017 | $3,235 | $198,699 | $44,154 | $154,545 |
| 2016 | $3,078 | $194,804 | $43,289 | $151,515 |
| 2015 | $3,061 | $191,879 | $42,639 | $149,240 |
| 2014 | $2,947 | $188,121 | $41,804 | $146,317 |
Source: Public Records
Map
Nearby Homes
- 11400 Regarse Dr
- 11507 Eresma Dr
- 11117 Grand Prairie Dr
- 11207 Vista Del Luna Dr
- 3815 Ames Ln
- 3701 Parterre Ct
- 12519 Cornelia Way
- 11102 Vista Del Rancho Dr
- 11109 Vista Del Luna Dr
- 11602 Trabancos Dr
- 11405 Sangrado Dr
- 11110 Vista Del Valle Dr
- 11416 Mondego Dr
- 10800 Vista Del Rancho Dr
- 6000 Calatrava Dr
- 11421 Mondego Dr
- 10413 Sirretta Peak Place
- 6411 Henares St
- 10711 Pleasant Valley Dr
- 5118 Vista Del Mar Ave
- 11125 Rancho Cordova St
- 11207 Rancho Cordova St
- 11126 Golden Valley Dr
- 11121 Rancho Cordova St
- 11122 Golden Valley Dr
- 11130 Golden Valley Dr
- 11211 Rancho Cordova St
- 11118 Golden Valley Dr
- 11202 Rancho Cordova St
- 11124 Rancho Cordova St
- 11117 Rancho Cordova St
- 11120 Rancho Cordova St
- 11206 Rancho Cordova St
- 11210 Rancho Cordova St
- 11114 Golden Valley Dr
- 5801 Lone Point Way
- 11116 Rancho Cordova St
- 11113 Rancho Cordova St
- 11110 Golden Valley Dr
- 11127 Golden Valley Dr