Y
Landlord's Agent in 2024
YIN LAM
Homes For You, Inc.
(678) 468-4683
23 Total Sales
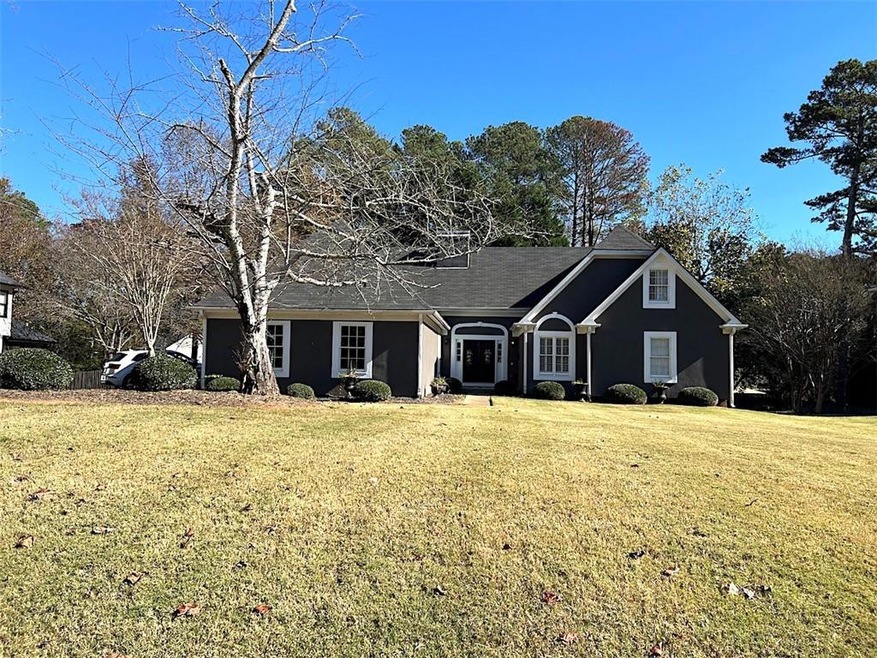
Beautiful Ranch with Upstairs Loft in Top School District. Excellent location in Johns Creek! This house features 3 large bedrooms on main with 2 full baths and 1 bed with full bath on the loft. Large, Bright and High ceiling kitchen with island and SS appliances, perfect for gatherings. Open floor plan. Large private fenced backyard with Swimming pool and huge wooded deck for entertaining or children's play area. Convenient to shopping and restaurants. 700+ credit score and 3x monthly rent income are required. ** Some of light fixture belong to current tenant and will be removed upon she move out.
| Date | Buyer | Sale Price | Title Company |
|---|---|---|---|
| Xu Jing | $257,000 | -- |
| Date | Event | Price | List to Sale | Price per Sq Ft | Prior Sale |
|---|---|---|---|---|---|
| 12/12/2024 12/12/24 | Rented | $3,500 | 0.0% | -- | |
| 11/26/2024 11/26/24 | Under Contract | -- | -- | -- | |
| 11/14/2024 11/14/24 | For Rent | $3,500 | +3.2% | -- | |
| 12/09/2022 12/09/22 | Rented | $3,390 | 0.0% | -- | |
| 11/17/2022 11/17/22 | Under Contract | -- | -- | -- | |
| 11/12/2022 11/12/22 | Price Changed | $3,390 | +2.7% | $1 / Sq Ft | |
| 11/08/2022 11/08/22 | For Rent | $3,300 | +26.9% | -- | |
| 09/26/2020 09/26/20 | Rented | $2,600 | 0.0% | -- | |
| 09/17/2020 09/17/20 | Under Contract | -- | -- | -- | |
| 09/08/2020 09/08/20 | For Rent | $2,600 | +4.0% | -- | |
| 02/01/2019 02/01/19 | Rented | $2,500 | 0.0% | -- | |
| 01/29/2019 01/29/19 | Under Contract | -- | -- | -- | |
| 11/26/2018 11/26/18 | For Rent | $2,500 | +9.2% | -- | |
| 06/02/2018 06/02/18 | Rented | $2,290 | 0.0% | -- | |
| 05/22/2018 05/22/18 | Under Contract | -- | -- | -- | |
| 04/02/2018 04/02/18 | For Rent | $2,290 | -0.4% | -- | |
| 10/09/2017 10/09/17 | Rented | $2,300 | 0.0% | -- | |
| 09/01/2017 09/01/17 | For Rent | $2,300 | 0.0% | -- | |
| 04/13/2017 04/13/17 | Sold | $257,000 | -11.4% | $71 / Sq Ft | View Prior Sale |
| 03/14/2017 03/14/17 | Pending | -- | -- | -- | |
| 03/10/2017 03/10/17 | For Sale | $290,000 | -- | $80 / Sq Ft |
| Year | Tax Paid | Tax Assessment Tax Assessment Total Assessment is a certain percentage of the fair market value that is determined by local assessors to be the total taxable value of land and additions on the property. | Land | Improvement |
|---|---|---|---|---|
| 2025 | $5,307 | $282,120 | $53,600 | $228,520 |
| 2023 | $4,990 | $176,800 | $30,960 | $145,840 |
| 2022 | $5,125 | $167,000 | $30,960 | $136,040 |
| 2021 | $5,109 | $162,160 | $30,080 | $132,080 |
| 2020 | $5,158 | $160,240 | $29,720 | $130,520 |
| 2019 | $621 | $157,400 | $29,200 | $128,200 |
| 2018 | $3,348 | $102,800 | $17,960 | $84,840 |
| 2017 | $3,809 | $124,080 | $14,400 | $109,680 |
| 2016 | $3,418 | $124,080 | $14,400 | $109,680 |
| 2015 | $2,737 | $93,360 | $14,400 | $78,960 |
| 2014 | $2,807 | $93,360 | $14,400 | $78,960 |
Y
Landlord's Agent in 2024
YIN LAM
Homes For You, Inc.
(678) 468-4683
23 Total Sales

Tenant's Agent in 2024
Tary Drouault
Keller Williams Realty Atlanta Partners
(770) 605-2221
217 Total Sales
N
Buyer's Agent in 2022
NON-MLS NMLS
Non FMLS Member
C
Seller's Agent in 2017
Christine Fownes
Keller Williams Realty Chattahoochee North, LLC
(770) 714-8017
4 Total Sales
Buyer's Agent in 2017
Jeny Paz
Virtual Properties Realty.com
(678) 650-3747
132 Total Sales
Source: First Multiple Listing Service (FMLS)
MLS Number: 7486277
APN: 11-0781-0277-037-0
Disclaimer: Certain information contained herein is derived from information provided by parties other than Homes.com. All information provided is deemed reliable, but is not guaranteed to be accurate and should be independently verified.
![]() Listings identified with the FMLS IDX logo come from FMLS and are held by brokerage firms other than the owner of this website. The listing brokerage is identified in any listing details. Information is deemed reliable but is not guaranteed. If you believe any FMLS listing contains material that infringes your copyrighted work please visit www.fmls.com/dmca to review our DMCA policy and learn how to submit a takedown request. © 2025 First Multiple Listing Service, Inc.
Listings identified with the FMLS IDX logo come from FMLS and are held by brokerage firms other than the owner of this website. The listing brokerage is identified in any listing details. Information is deemed reliable but is not guaranteed. If you believe any FMLS listing contains material that infringes your copyrighted work please visit www.fmls.com/dmca to review our DMCA policy and learn how to submit a takedown request. © 2025 First Multiple Listing Service, Inc.