Estimated Value: $577,000 - $791,000
3
Beds
2
Baths
1,785
Sq Ft
$378/Sq Ft
Est. Value
About This Home
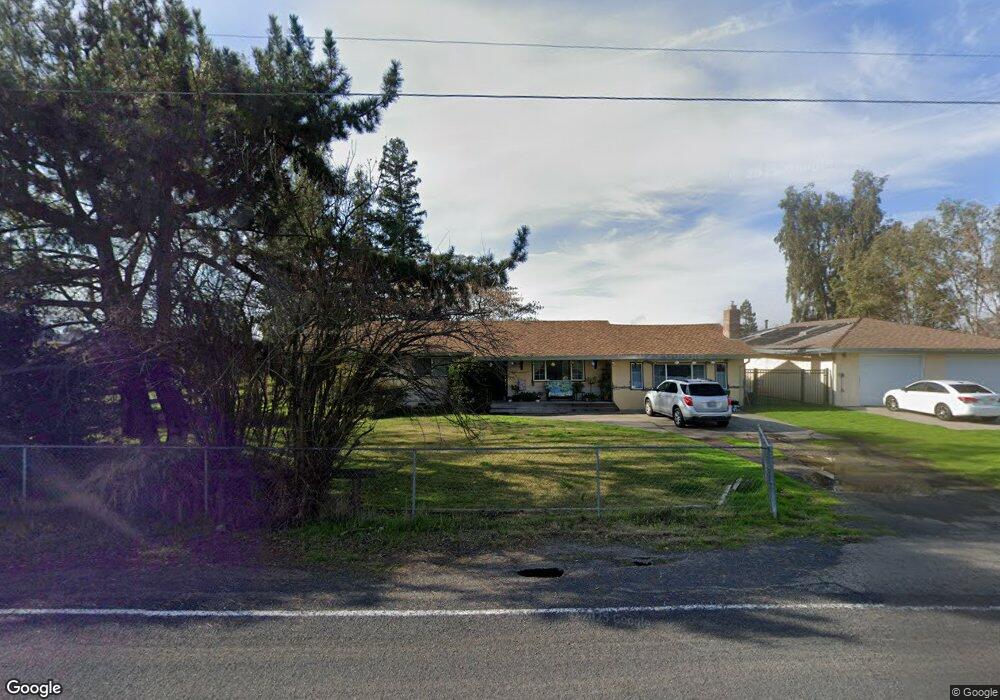
This home is located at 11207 N Golfview Rd, Lodi, CA 95240 and is currently estimated at $675,214, approximately $378 per square foot. 11207 N Golfview Rd is a home located in San Joaquin County with nearby schools including Live Oak Elementary School, Morada Middle School, and Tokay High School.
Ownership History
Date
Name
Owned For
Owner Type
Purchase Details
Closed on
Feb 14, 2001
Sold by
Tankersley David N and Tankersley Sally
Bought by
Tankersley David N and Tankersley Sally
Current Estimated Value
Purchase Details
Closed on
Jun 22, 2000
Sold by
Urata Nola J
Bought by
Keefer Harvey R and Keefer Jill E
Home Financials for this Owner
Home Financials are based on the most recent Mortgage that was taken out on this home.
Original Mortgage
$80,750
Outstanding Balance
$29,298
Interest Rate
8.63%
Mortgage Type
Seller Take Back
Estimated Equity
$645,916
Purchase Details
Closed on
Mar 15, 1995
Sold by
Source One Mtg Services Corp
Bought by
Tankersley David N and Tankersley Sally
Home Financials for this Owner
Home Financials are based on the most recent Mortgage that was taken out on this home.
Original Mortgage
$90,000
Interest Rate
8.86%
Purchase Details
Closed on
Oct 25, 1994
Sold by
Source One Mtg Services Corp
Bought by
Source One Mtg Services Corp and Firemans Fund Mtg Corp
Create a Home Valuation Report for This Property
The Home Valuation Report is an in-depth analysis detailing your home's value as well as a comparison with similar homes in the area
Purchase History
We collect this data history from publicly available records. To have your information removed, we recommend requesting removal directly through your county’s website.
| Date | Buyer | Sale Price | Title Company |
|---|---|---|---|
| Tankersley David N | -- | -- | |
| Keefer Harvey R | $95,000 | Fidelity National Title Co | |
| Tankersley David N | $145,000 | Fidelity National Title Co | |
| Source One Mtg Services Corp | $84,000 | Fidelity National Title Co |
Source: Public Records
Mortgage History
We collect this data history from publicly available records. To have your information removed, we recommend requesting removal directly through your county’s website.
| Date | Status | Borrower | Loan Amount |
|---|---|---|---|
| Open | Keefer Harvey R | $80,750 | |
| Previous Owner | Tankersley David N | $90,000 |
Source: Public Records
Tax History
| Year | Tax Paid | Tax Assessment Tax Assessment Total Assessment is a certain percentage of the fair market value that is determined by local assessors to be the total taxable value of land and additions on the property. | Land | Improvement |
|---|---|---|---|---|
| 2025 | $3,586 | $285,053 | $125,961 | $159,092 |
| 2024 | $3,425 | $279,465 | $123,492 | $155,973 |
| 2023 | $3,389 | $273,986 | $121,071 | $152,915 |
| 2022 | $3,319 | $268,615 | $118,698 | $149,917 |
| 2021 | $3,387 | $263,349 | $116,371 | $146,978 |
| 2020 | $3,313 | $260,649 | $115,178 | $145,471 |
| 2019 | $3,243 | $255,539 | $112,920 | $142,619 |
| 2018 | $2,957 | $250,529 | $110,706 | $139,823 |
| 2017 | $2,888 | $245,618 | $108,536 | $137,082 |
| 2016 | $2,726 | $240,804 | $106,408 | $134,396 |
| 2014 | $2,687 | $232,541 | $102,757 | $129,784 |
Source: Public Records
Map
Nearby Homes
- 10780 N Highway 99 Unit 45
- 10780 N Highway 99 Unit 13
- 10780 N Highway 99 Unit 55
- 10780 N Highway 99
- 10605 Coolio Way
- 3600 Pride Way
- 10434 Sabbath Ln
- 3200 Aerosmith Way
- 3024 Aerosmith Way
- 10424 Allman Dr
- 4055 Keith Ln
- 10418 Allman Dr
- 4067 Keith Ln
- 4079 Keith Ln
- 4020 Keith Ln
- 10597 Aretha Ln
- 10450 Fender Way
- 10609 Aretha Ln
- 10670 Aretha Ln
- 10658 Aretha Ln
- 11195 N Golfview Rd
- 11173 N Golfview Rd
- 11253 N Golfview Rd
- 11174 N Golfview Rd
- 11169 N Golfview Rd
- 11190 N Golfview Rd
- 11247 N Golfview Rd
- 11158 N Golfview Rd
- 11260 N Golfview Rd
- 11157 N Golfview Rd
- 11146 N Golfview Rd
- 11146 N Golfview Rd
- 11263 N Golfview Rd
- 11128 N Golfview Rd
- 11266 N Golfview Rd
- 11297 N Golfview Rd
- 11272 N Golfview Rd
- 11145 N Golfview Rd
- 11300 N Golfview Rd
- 11110 N Golfview Rd
Your Personal Tour Guide
Ask me questions while you tour the home.