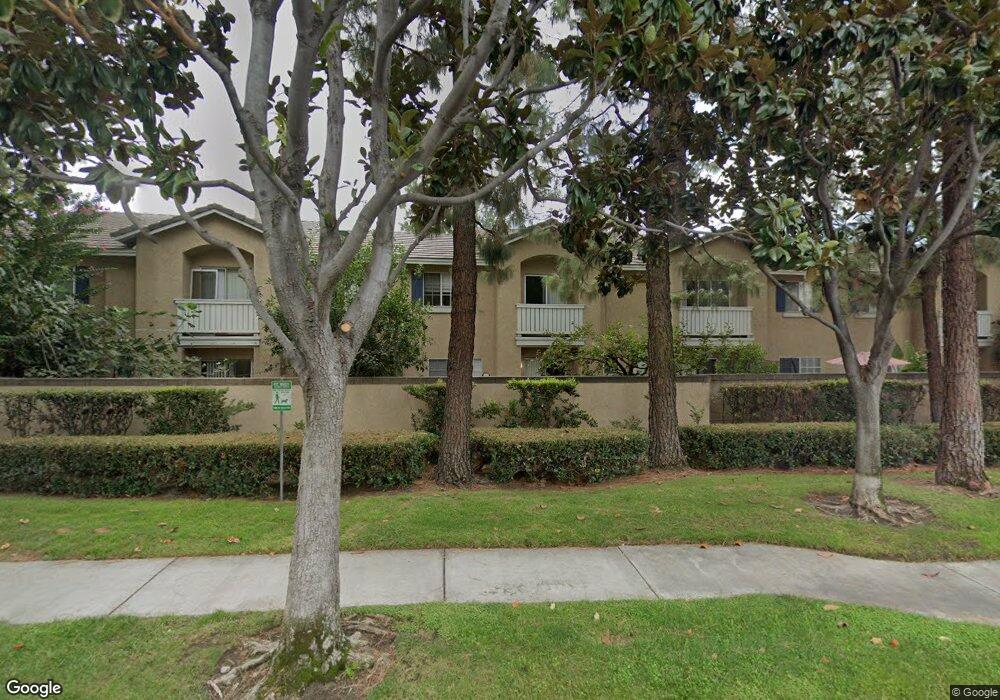
11209 Terra Vista Pkwy Unit 4 Rancho Cucamonga, CA 91730
Terra Vista NeighborhoodEstimated Value: $569,000 - $602,000
3
Beds
3
Baths
1,417
Sq Ft
$414/Sq Ft
Est. Value
About This Home
This home is located at 11209 Terra Vista Pkwy Unit 4, Rancho Cucamonga, CA 91730 and is currently estimated at $586,800, approximately $414 per square foot. 11209 Terra Vista Pkwy Unit 4 is a home located in San Bernardino County with nearby schools including Ruth Musser Middle, Coyote Canyon Elementary, and Rancho Cucamonga High School.
Ownership History
Date
Name
Owned For
Owner Type
Purchase Details
Closed on
Sep 10, 2021
Sold by
Lim Cindy T
Bought by
Lim Cindy and Paclipan Samuel Q
Current Estimated Value
Home Financials for this Owner
Home Financials are based on the most recent Mortgage that was taken out on this home.
Original Mortgage
$364,000
Outstanding Balance
$306,005
Interest Rate
2.7%
Mortgage Type
New Conventional
Estimated Equity
$280,795
Purchase Details
Closed on
Sep 10, 2018
Sold by
Paclipan Samuel Q
Bought by
Lim Cindy T
Home Financials for this Owner
Home Financials are based on the most recent Mortgage that was taken out on this home.
Original Mortgage
$344,700
Interest Rate
4.5%
Mortgage Type
New Conventional
Purchase Details
Closed on
Mar 31, 1994
Sold by
Willsey Robert H
Bought by
Willsey Robert H and Willsey Lois A
Purchase Details
Closed on
Mar 22, 1993
Sold by
Lewis Development Co
Bought by
Willsey Robert H and Willsey Lois A
Create a Home Valuation Report for This Property
The Home Valuation Report is an in-depth analysis detailing your home's value as well as a comparison with similar homes in the area
Home Values in the Area
Average Home Value in this Area
Purchase History
| Date | Buyer | Sale Price | Title Company |
|---|---|---|---|
| Lim Cindy | -- | Corinthian Title Company | |
| Lim Cindy T | -- | Ticor Title Company Of Calif | |
| Lim Cindy T | $383,000 | Ticor Title Company Of Calif | |
| Willsey Robert H | -- | Chicago Title | |
| Willsey Robert H | $134,000 | Chicago Title Company |
Source: Public Records
Mortgage History
| Date | Status | Borrower | Loan Amount |
|---|---|---|---|
| Open | Lim Cindy | $364,000 | |
| Closed | Lim Cindy T | $344,700 |
Source: Public Records
Tax History Compared to Growth
Tax History
| Year | Tax Paid | Tax Assessment Tax Assessment Total Assessment is a certain percentage of the fair market value that is determined by local assessors to be the total taxable value of land and additions on the property. | Land | Improvement |
|---|---|---|---|---|
| 2025 | $5,158 | $427,244 | $106,811 | $320,433 |
| 2024 | $5,158 | $418,867 | $104,717 | $314,150 |
| 2023 | $5,030 | $410,654 | $102,664 | $307,990 |
| 2022 | $4,932 | $402,602 | $100,651 | $301,951 |
| 2021 | $4,931 | $394,707 | $98,677 | $296,030 |
| 2020 | $4,804 | $390,660 | $97,665 | $292,995 |
| 2019 | $4,783 | $383,000 | $95,750 | $287,250 |
| 2018 | $2,295 | $168,395 | $42,099 | $126,296 |
| 2017 | $2,261 | $165,094 | $41,274 | $123,820 |
| 2016 | $2,256 | $161,857 | $40,465 | $121,392 |
| 2015 | $2,228 | $159,426 | $39,857 | $119,569 |
| 2014 | $2,170 | $156,303 | $39,076 | $117,227 |
Source: Public Records
Map
Nearby Homes
- 11278 Terra Vista Pkwy Unit 120
- 7331 Belpine Place Unit 31
- 11318 Fitzpatrick Dr
- 7522 Calais Ct
- 7668 Belpine Place
- 11090 Mountain View Dr Unit 53
- 7353 Ellena W Unit 3
- 7271 Venosa Place
- 7346 Springmill Place
- 7116 Sapri Place
- 10847 Spyglass Dr
- 7759 Devonshire Ct
- 7343 Legacy Place
- 6979 Walker Ct
- 11266 Gannon St
- 7358 Freedom Place
- 11017 Piedmont St
- 11450 Church St Unit 167
- 6999 Canosa Place
- 11253 Drake St
- 11209 Terra Vista Pkwy Unit D
- 11209 Terra Vista Pkwy Unit F
- 11209 Terra Vista Pkwy Unit C
- 11209 Terra Vista Pkwy
- 11209 Terra Vista Pkwy Unit H
- 11209 Terra Vista Pkwy Unit G
- 11209 Terra Vista Pkwy Unit 5
- 11209 Terra Vista Pkwy Unit 3
- 11209 Terra Vista Pkwy Unit B
- 11209 Terra Vista Pkwy Unit 8
- 11209 Terra Vista Pkwy Unit 6
- 11209 Terra Vista Pkwy Unit 109
- 11207 Terra Vista Pkwy Unit 1
- 7559 Belpine Place
- 11213 Terra Vista Pkwy Unit B
- 11213 Terra Vista Pkwy
- 11213 Terra Vista Pkwy Unit E
- 11213 Terra Vista Pkwy Unit 14
- 11213 Terra Vista Pkwy Unit 13