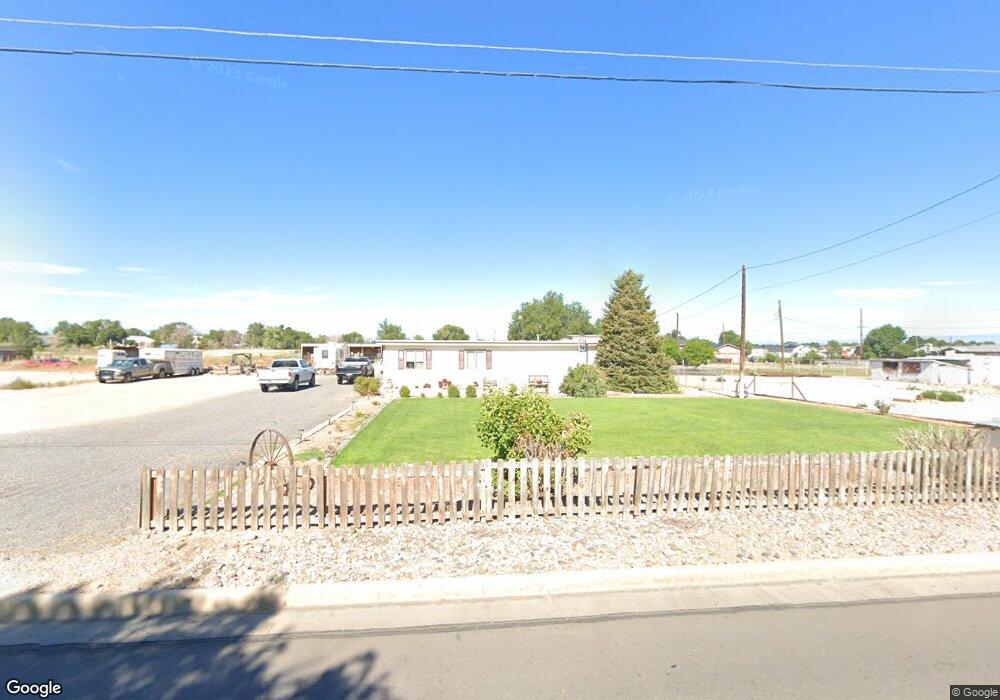
1121 29th Ln Pueblo, CO 81006
Estimated Value: $281,049 - $406,000
3
Beds
3
Baths
1,265
Sq Ft
$287/Sq Ft
Est. Value
About This Home
This home is located at 1121 29th Ln, Pueblo, CO 81006 and is currently estimated at $363,012, approximately $286 per square foot. 1121 29th Ln is a home located in Pueblo County with nearby schools including Vineland Elementary School, Vineland Middle School, and Pueblo County High School.
Ownership History
Date
Name
Owned For
Owner Type
Purchase Details
Closed on
May 24, 2004
Sold by
Cozzetto Jason A
Bought by
Cozzetto Jason A + Pamela L
Current Estimated Value
Purchase Details
Closed on
Mar 24, 2004
Sold by
Cozzetto Jason A + Pamela L
Bought by
Cozzetto Jason A
Purchase Details
Closed on
Oct 23, 2002
Sold by
Cozzetto J A J and Cozzetto Estrada P
Bought by
Cozzetto Jason A + Pamela L
Purchase Details
Closed on
Feb 9, 2000
Sold by
Dockter Dale E
Bought by
Cozzetto J A J and Cozzetto Estrada P
Purchase Details
Closed on
Nov 12, 1998
Sold by
Cornell Susan D
Bought by
Dockter Dale E
Purchase Details
Closed on
Aug 14, 1998
Sold by
Cornell Dana A + Susan D
Bought by
Cornell Susan D
Purchase Details
Closed on
Nov 15, 1990
Sold by
Gilchrist Joseph V + Dorris E
Bought by
Cornell Dana A + Susan D
Purchase Details
Closed on
Jul 9, 1980
Sold by
Maes Joe R
Bought by
Gilchrist Joseph V + Dorris E
Purchase Details
Closed on
Mar 30, 1977
Sold by
Estep Robert E + Ruth T
Bought by
Maes Joe R
Create a Home Valuation Report for This Property
The Home Valuation Report is an in-depth analysis detailing your home's value as well as a comparison with similar homes in the area
Home Values in the Area
Average Home Value in this Area
Purchase History
| Date | Buyer | Sale Price | Title Company |
|---|---|---|---|
| Cozzetto Jason A + Pamela L | -- | -- | |
| Cozzetto Jason A | -- | -- | |
| Cozzetto Jason A + Pamela L | -- | -- | |
| Cozzetto J A J | $85,000 | -- | |
| Dockter Dale E | -- | -- | |
| Cornell Susan D | -- | -- | |
| Cornell Dana A + Susan D | $49,000 | -- | |
| Gilchrist Joseph V + Dorris E | $10,800 | -- | |
| Maes Joe R | $8,500 | -- |
Source: Public Records
Tax History Compared to Growth
Tax History
| Year | Tax Paid | Tax Assessment Tax Assessment Total Assessment is a certain percentage of the fair market value that is determined by local assessors to be the total taxable value of land and additions on the property. | Land | Improvement |
|---|---|---|---|---|
| 2024 | $1,282 | $12,110 | -- | -- |
| 2023 | $1,297 | $15,800 | $3,750 | $12,050 |
| 2022 | $1,358 | $12,861 | $3,020 | $9,841 |
| 2021 | $1,419 | $13,230 | $3,100 | $10,130 |
| 2020 | $1,218 | $11,330 | $2,860 | $8,470 |
| 2019 | $1,195 | $11,334 | $2,860 | $8,474 |
| 2018 | $1,013 | $9,603 | $2,880 | $6,723 |
| 2017 | $1,038 | $9,603 | $2,880 | $6,723 |
| 2016 | $1,060 | $9,796 | $3,184 | $6,612 |
| 2015 | $1,054 | $9,796 | $3,184 | $6,612 |
| 2014 | $1,014 | $9,433 | $3,184 | $6,249 |
Source: Public Records
Map
Nearby Homes
- 28513 Hillside Rd
- 1145 Wago Dr
- TBD Hillside Rd
- 29380 Windrow Dr
- 945 29th Ln
- 1040 28th Ln
- 28922 Everett Rd
- 27875 County Farm Rd
- 29767 Preston Rd
- 1419 27 1 2 Ln
- 760 28 1 2 Ln
- 1470 Villa Spanada St
- 27193 County Farm Rd
- 1557 28th Ln
- 27454 Preston Rd
- 26680 Everett Rd
- TBD 27th Ln
- 843 Baxter Rd
- 27111 Preston Rd
- 32006 Ford Rd
- 28850 E Hwy 50
- 28850 E Us Highway 50
- 28850 E Us Highway 50
- 1147 29th Ln
- 28948 E Us Highway 50
- 28840 E Us Highway 50
- 1153 29th Ln
- 1159 29th Ln
- 1158 29th Ln
- 28851 E Us Highway 50
- 28855 Hillside Rd
- 29119 Karen Rd
- 29048 Karen Rd
- 29138 E Us Highway 50
- 1076 Peaceful Ct
- 29101 E Us Highway 50
- 1179 29th Ln
- 1175 29th Ln
- 29118 Karen Rd
- 29171 Karen Rd