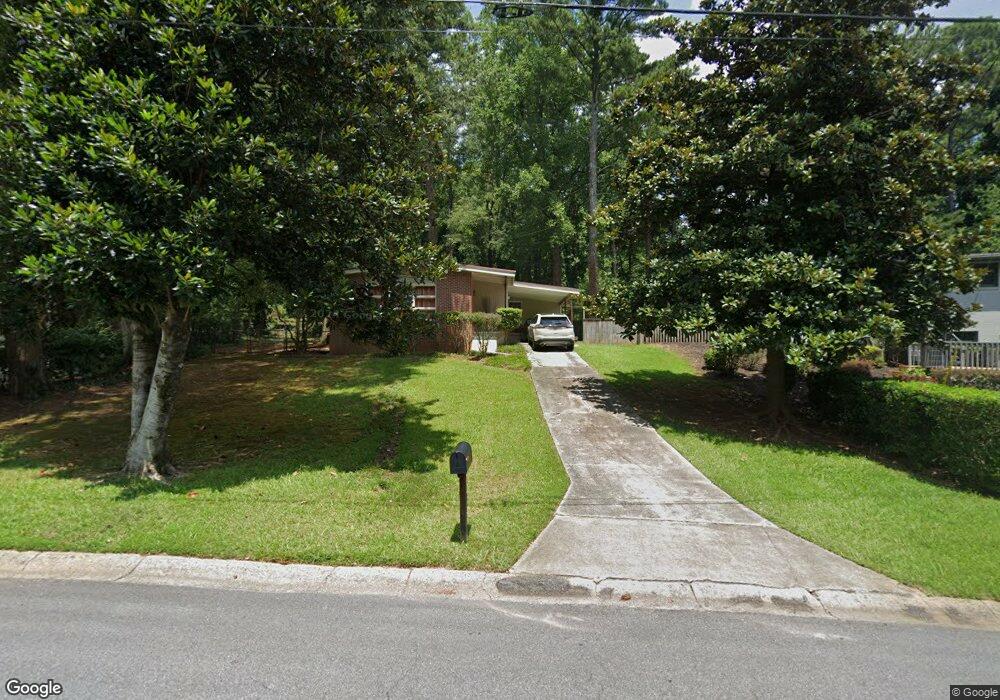
1121 Baker Ln Marietta, GA 30062
Estimated Value: $316,000 - $335,000
3
Beds
2
Baths
1,182
Sq Ft
$272/Sq Ft
Est. Value
About This Home
This home is located at 1121 Baker Ln, Marietta, GA 30062 and is currently estimated at $321,908, approximately $272 per square foot. 1121 Baker Ln is a home located in Cobb County with nearby schools including Lockheed Elementary School, Marietta Sixth Grade Academy, and Marietta Middle School.
Ownership History
Date
Name
Owned For
Owner Type
Purchase Details
Closed on
Aug 28, 2008
Sold by
Padro Lydia C
Bought by
Mejia Jema
Current Estimated Value
Home Financials for this Owner
Home Financials are based on the most recent Mortgage that was taken out on this home.
Original Mortgage
$143,881
Outstanding Balance
$94,269
Interest Rate
6.21%
Mortgage Type
FHA
Estimated Equity
$227,639
Purchase Details
Closed on
Aug 16, 2002
Sold by
Padro Lydia C
Bought by
Padro Lydia C and Padro Lena K
Purchase Details
Closed on
Oct 5, 2001
Sold by
Gaskin Reggie A
Bought by
Padto Lydia C
Purchase Details
Closed on
Jul 27, 2000
Sold by
Lea Linda M
Bought by
Padro Lydia C
Home Financials for this Owner
Home Financials are based on the most recent Mortgage that was taken out on this home.
Original Mortgage
$107,580
Interest Rate
8.17%
Mortgage Type
FHA
Purchase Details
Closed on
May 25, 1995
Sold by
Drury Ervin D and Drury Jennifer
Bought by
Lea Kevin D Linda M
Create a Home Valuation Report for This Property
The Home Valuation Report is an in-depth analysis detailing your home's value as well as a comparison with similar homes in the area
Home Values in the Area
Average Home Value in this Area
Purchase History
| Date | Buyer | Sale Price | Title Company |
|---|---|---|---|
| Mejia Jema | $146,500 | -- | |
| Padro Lydia C | -- | -- | |
| Padto Lydia C | $3,000 | -- | |
| Padro Lydia C | $109,000 | -- | |
| Lea Kevin D Linda M | $74,500 | -- |
Source: Public Records
Mortgage History
| Date | Status | Borrower | Loan Amount |
|---|---|---|---|
| Open | Mejia Jema | $143,881 | |
| Previous Owner | Padro Lydia C | $107,580 |
Source: Public Records
Tax History Compared to Growth
Tax History
| Year | Tax Paid | Tax Assessment Tax Assessment Total Assessment is a certain percentage of the fair market value that is determined by local assessors to be the total taxable value of land and additions on the property. | Land | Improvement |
|---|---|---|---|---|
| 2024 | $324 | $142,140 | $44,000 | $98,140 |
| 2023 | $172 | $111,648 | $44,000 | $67,648 |
| 2022 | $324 | $88,260 | $44,000 | $44,260 |
| 2021 | $333 | $68,948 | $10,000 | $58,948 |
| 2020 | $333 | $68,948 | $10,000 | $58,948 |
| 2019 | $333 | $68,948 | $10,000 | $58,948 |
| 2018 | $332 | $58,772 | $8,000 | $50,772 |
| 2017 | $266 | $51,788 | $8,000 | $43,788 |
| 2016 | $267 | $51,788 | $8,000 | $43,788 |
| 2015 | $210 | $37,492 | $8,000 | $29,492 |
| 2014 | $135 | $26,892 | $0 | $0 |
Source: Public Records
Map
Nearby Homes
- 1111 Baker Ln
- 1131 Baker Ln
- 1103 Baker Ln
- 1141 Baker Ln
- 1092 Mountain View Dr
- 1096 Mountain View Dr
- 750 Bonnie Dell Dr
- 1126 Baker Ln
- 746 Bonnie Dell Dr
- 1084 Mountain View Dr
- 1106 Baker Ln
- 748 Bonnie Dell Dr
- 1097 Baker Ln
- 1153 Baker Ln
- 752 Bonnie Dell Dr
- 1134 Baker Ln
- 1100 Mountain View Dr
- 1094 Baker Ln
- 758 Bonnie Dell Dr Unit 4
- 601 Bonnie Dell Dr