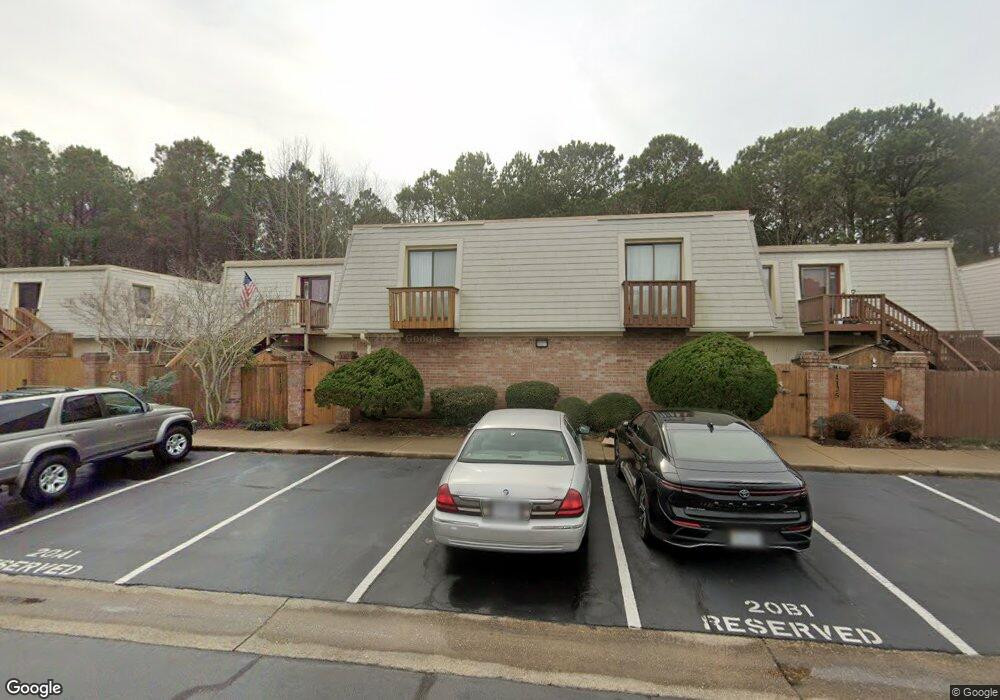
1121 Black Duck Ct Virginia Beach, VA 23451
Shadowlawn NeighborhoodEstimated Value: $270,923 - $288,000
2
Beds
2
Baths
948
Sq Ft
$291/Sq Ft
Est. Value
About This Home
This home is located at 1121 Black Duck Ct, Virginia Beach, VA 23451 and is currently estimated at $275,981, approximately $291 per square foot. 1121 Black Duck Ct is a home located in Virginia Beach City with nearby schools including W.T. Cooke Elementary School, Virginia Beach Middle School, and First Colonial High School.
Ownership History
Date
Name
Owned For
Owner Type
Purchase Details
Closed on
Feb 15, 2006
Sold by
Wilkins Cassius
Bought by
Ross Ryan
Current Estimated Value
Home Financials for this Owner
Home Financials are based on the most recent Mortgage that was taken out on this home.
Original Mortgage
$131,200
Outstanding Balance
$73,992
Interest Rate
6.23%
Mortgage Type
New Conventional
Estimated Equity
$201,989
Purchase Details
Closed on
Dec 16, 2005
Sold by
Wall Deborah
Bought by
Wilkins Cassius
Home Financials for this Owner
Home Financials are based on the most recent Mortgage that was taken out on this home.
Original Mortgage
$50,000
Interest Rate
6.36%
Mortgage Type
New Conventional
Create a Home Valuation Report for This Property
The Home Valuation Report is an in-depth analysis detailing your home's value as well as a comparison with similar homes in the area
Home Values in the Area
Average Home Value in this Area
Purchase History
| Date | Buyer | Sale Price | Title Company |
|---|---|---|---|
| Ross Ryan | $164,000 | -- | |
| Wilkins Cassius | $93,550 | -- |
Source: Public Records
Mortgage History
| Date | Status | Borrower | Loan Amount |
|---|---|---|---|
| Open | Ross Ryan | $131,200 | |
| Previous Owner | Wilkins Cassius | $50,000 |
Source: Public Records
Tax History Compared to Growth
Tax History
| Year | Tax Paid | Tax Assessment Tax Assessment Total Assessment is a certain percentage of the fair market value that is determined by local assessors to be the total taxable value of land and additions on the property. | Land | Improvement |
|---|---|---|---|---|
| 2025 | $2,127 | $237,300 | $95,000 | $142,300 |
| 2024 | $2,127 | $219,300 | $95,000 | $124,300 |
| 2023 | $1,999 | $201,900 | $89,000 | $112,900 |
| 2022 | $1,820 | $183,800 | $75,000 | $108,800 |
| 2021 | $1,649 | $166,600 | $75,000 | $91,600 |
| 2020 | $1,695 | $166,600 | $75,000 | $91,600 |
| 2019 | $1,653 | $149,300 | $67,000 | $82,300 |
| 2018 | $1,497 | $149,300 | $67,000 | $82,300 |
| 2017 | $1,507 | $150,300 | $68,000 | $82,300 |
| 2016 | $1,489 | $150,400 | $69,600 | $80,800 |
| 2015 | $1,419 | $143,300 | $69,600 | $73,700 |
| 2014 | $1,405 | $145,100 | $74,600 | $70,500 |
Source: Public Records
Map
Nearby Homes
- 1026 Lands End Way
- 1022 Angler Ln
- 1308 Blue Pete Rd
- 1107 Ocean Pebbles Way
- 1127 Ocean Pebbles Way
- 1132 Ocean Pebbles Way
- 926 13th St
- 1341 Preserve Dr
- 839 12th St
- 1021 Barclay Square
- 1307 Parks Ave
- 729 Virginia Ave Unit X4660
- 1093 Kenya Ln
- 731 Carolina Ave
- 1507 Colonnade Dr
- 1509 Parks Ave
- 1617 Colonnade Crescent
- 1207 Cypress Ave
- 629 12th St
- 622 Maryland Ave
- 1131 Black Duck Ct
- 1123 Black Duck Ct
- 1117 Black Duck Ct
- 1127 Black Duck Ct
- 1125 Black Duck Ct
- 1119 Black Duck Ct
- 1139 Black Duck Ct
- 1115 Black Duck Ct
- 1133 Black Duck Ct
- 1111 Black Duck Ct
- 1109 Black Duck Ct
- 1107 Black Duck Ct
- 1105 Black Duck Ct
- 1137 Black Duck Ct
- 1135 Black Duck Ct
- 1141 Black Duck Ct
- 1147 Black Duck Ct
- 1143 Black Duck Ct
- 1145 Black Duck Ct
- 402 Redhead Way