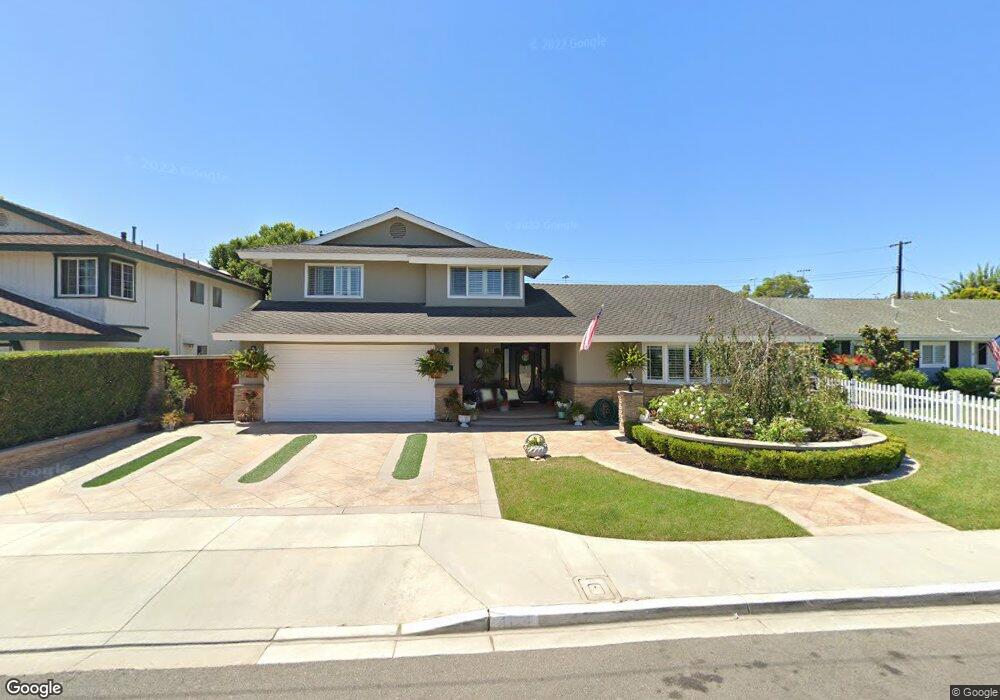
1121 Corona Ln Costa Mesa, CA 92626
Estimated Value: $1,782,000 - $2,240,163
5
Beds
4
Baths
3,268
Sq Ft
$597/Sq Ft
Est. Value
About This Home
This home is located at 1121 Corona Ln, Costa Mesa, CA 92626 and is currently estimated at $1,951,041, approximately $597 per square foot. 1121 Corona Ln is a home located in Orange County with nearby schools including Sonora Elementary School, Costa Mesa High School, and St. John the Baptist Catholic School.
Ownership History
Date
Name
Owned For
Owner Type
Purchase Details
Closed on
Jun 3, 2010
Sold by
Carich Andrew J and Carich Laura J
Bought by
Carich Andrew J and Carich Laura J
Current Estimated Value
Purchase Details
Closed on
Apr 14, 2010
Sold by
Carich Andrew J and Carich Laura J
Bought by
Carich Andrew J and Carich Laura J
Purchase Details
Closed on
Jun 18, 2002
Sold by
Carich Andrew J and Carich Laura J
Bought by
Carich Andrew J and Carich Laura J
Purchase Details
Closed on
Jul 28, 1999
Sold by
Randy Leckliter and Randy Tami Leckliter
Bought by
Carich Andrew Jack and Carich Laura J
Home Financials for this Owner
Home Financials are based on the most recent Mortgage that was taken out on this home.
Original Mortgage
$160,000
Outstanding Balance
$45,655
Interest Rate
7.56%
Estimated Equity
$1,905,386
Create a Home Valuation Report for This Property
The Home Valuation Report is an in-depth analysis detailing your home's value as well as a comparison with similar homes in the area
Home Values in the Area
Average Home Value in this Area
Purchase History
| Date | Buyer | Sale Price | Title Company |
|---|---|---|---|
| Carich Andrew J | -- | None Available | |
| Carich Andrew J | -- | None Available | |
| Carich Andrew J | -- | -- | |
| Carich Andrew J | -- | -- | |
| Carich Andrew Jack | $300,000 | Chicago Title Co |
Source: Public Records
Mortgage History
| Date | Status | Borrower | Loan Amount |
|---|---|---|---|
| Open | Carich Andrew Jack | $160,000 |
Source: Public Records
Tax History Compared to Growth
Tax History
| Year | Tax Paid | Tax Assessment Tax Assessment Total Assessment is a certain percentage of the fair market value that is determined by local assessors to be the total taxable value of land and additions on the property. | Land | Improvement |
|---|---|---|---|---|
| 2025 | $6,891 | $570,001 | $298,894 | $271,107 |
| 2024 | $6,891 | $558,825 | $293,033 | $265,792 |
| 2023 | $6,661 | $547,868 | $287,287 | $260,581 |
| 2022 | $6,441 | $537,126 | $281,654 | $255,472 |
| 2021 | $6,253 | $526,595 | $276,132 | $250,463 |
| 2020 | $6,179 | $521,196 | $273,301 | $247,895 |
| 2019 | $6,048 | $510,977 | $267,942 | $243,035 |
| 2018 | $5,927 | $500,958 | $262,688 | $238,270 |
| 2017 | $5,829 | $491,136 | $257,537 | $233,599 |
| 2016 | $5,706 | $481,506 | $252,487 | $229,019 |
| 2015 | $5,652 | $474,274 | $248,695 | $225,579 |
| 2014 | $5,525 | $464,984 | $243,823 | $221,161 |
Source: Public Records
Map
Nearby Homes
- 2865 Mendoza Dr
- 1202 Hazel Place
- 1034 El Camino Dr
- 1030 Palmetto Way
- 1016 Valencia St
- 1010 Valencia St
- 994 Valencia St
- 2750 San Carlos Ln
- 3040 Fillmore Way
- 945 Brilliance Ln
- 3050 Madison Ave
- 2817 Portola Dr
- 403 Aura Dr
- 101 Clearbrook Ln
- 117 Clearbrook Ln
- 2520 Andover Place
- 3149 Sharon Ln
- 419 Aura Dr
- 157 Yorktown Ln
- 783 Grayling
- 1115 Corona Ln
- 1127 Corona Ln
- 1120 Salvador St
- 1114 Salvador St
- 1126 Salvador St
- 1109 Corona Ln
- 1133 Corona Ln
- 1122 Corona Ln
- 1116 Corona Ln
- 1108 Salvador St
- 1132 Salvador St
- 1128 Corona Ln
- 1112 Corona Ln
- 1103 Corona Ln
- 1132 Corona Ln
- 1102 Salvador St
- 1108 Corona Ln
- 1121 Salvador St
- 1121 El Camino Dr
- 1127 El Camino Dr