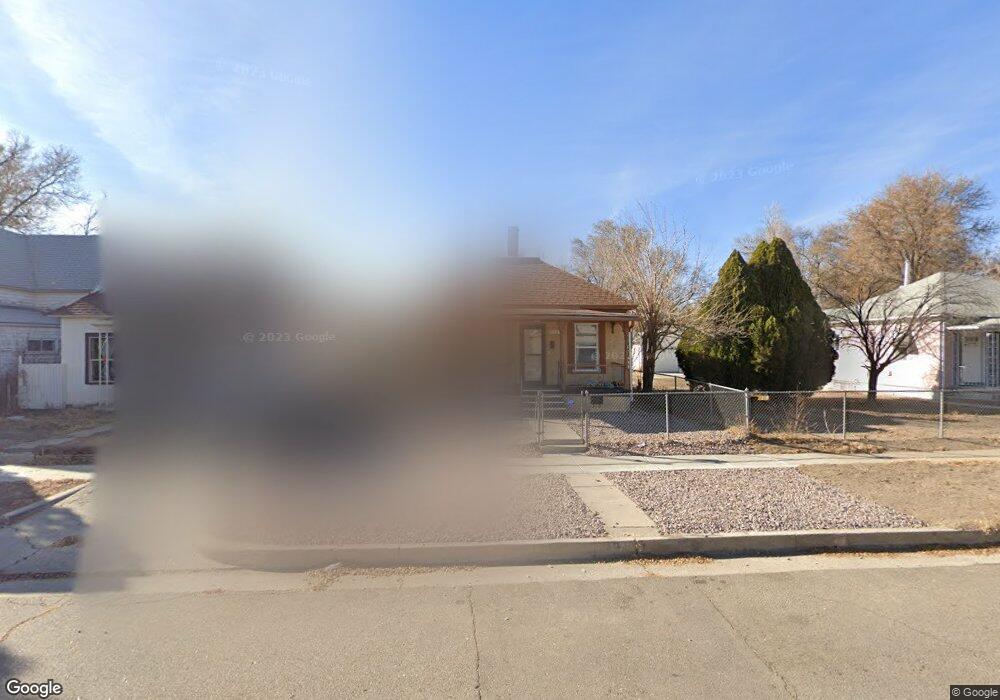
1121 Cypress St Pueblo, CO 81004
Bessemer NeighborhoodEstimated Value: $114,407 - $158,000
2
Beds
1
Bath
732
Sq Ft
$176/Sq Ft
Est. Value
About This Home
This home is located at 1121 Cypress St, Pueblo, CO 81004 and is currently estimated at $128,852, approximately $176 per square foot. 1121 Cypress St is a home located in Pueblo County with nearby schools including Bessemer Elementary School, Pueblo Academy of Arts, and Central High School.
Ownership History
Date
Name
Owned For
Owner Type
Purchase Details
Closed on
Sep 11, 2025
Sold by
Simpson Leland Taj and Simpson Lisa
Bought by
Brothers Capital Llc
Current Estimated Value
Purchase Details
Closed on
Mar 18, 2022
Sold by
Taj Simpson Leland
Bought by
Simpson Leland Taj and Simpson Lisa
Home Financials for this Owner
Home Financials are based on the most recent Mortgage that was taken out on this home.
Original Mortgage
$100,000
Interest Rate
4.16%
Mortgage Type
New Conventional
Purchase Details
Closed on
Jun 17, 2020
Sold by
Morris Frison L and Morris Joyce
Bought by
Simpson Leland Taj
Purchase Details
Closed on
Sep 24, 1987
Sold by
Frison Katherine Diann
Bought by
Frison Morris L + Joyce
Purchase Details
Closed on
Mar 10, 1983
Sold by
Frison Morris L + Joyce
Bought by
Frison Katherine Diann
Purchase Details
Closed on
Mar 8, 1983
Sold by
Firson Morris + J and Firson Range I
Bought by
Frison Morris L + Joyce
Purchase Details
Closed on
Apr 1, 1975
Sold by
Frison Morris L
Bought by
Firson Morris + J and Firson Range I
Create a Home Valuation Report for This Property
The Home Valuation Report is an in-depth analysis detailing your home's value as well as a comparison with similar homes in the area
Home Values in the Area
Average Home Value in this Area
Purchase History
| Date | Buyer | Sale Price | Title Company |
|---|---|---|---|
| Brothers Capital Llc | $101,700 | Land Title Guarantee | |
| Simpson Leland Taj | -- | None Listed On Document | |
| Simpson Leland Taj | -- | None Available | |
| Frison Morris L + Joyce | -- | -- | |
| Frison Katherine Diann | $15,000 | -- | |
| Frison Morris L + Joyce | -- | -- | |
| Firson Morris + J | -- | -- |
Source: Public Records
Mortgage History
| Date | Status | Borrower | Loan Amount |
|---|---|---|---|
| Previous Owner | Simpson Leland Taj | $100,000 |
Source: Public Records
Tax History Compared to Growth
Tax History
| Year | Tax Paid | Tax Assessment Tax Assessment Total Assessment is a certain percentage of the fair market value that is determined by local assessors to be the total taxable value of land and additions on the property. | Land | Improvement |
|---|---|---|---|---|
| 2024 | $473 | $4,750 | -- | -- |
| 2023 | $477 | $8,440 | $1,010 | $7,430 |
| 2022 | $447 | $4,502 | $450 | $4,052 |
| 2021 | $461 | $4,630 | $460 | $4,170 |
| 2020 | $323 | $4,630 | $460 | $4,170 |
| 2019 | $324 | $3,205 | $174 | $3,031 |
| 2018 | $235 | $2,594 | $176 | $2,418 |
| 2017 | $237 | $2,594 | $176 | $2,418 |
| 2016 | $221 | $2,432 | $194 | $2,238 |
| 2015 | $220 | $2,432 | $194 | $2,238 |
| 2014 | $117 | $2,590 | $194 | $2,396 |
Source: Public Records
Map
Nearby Homes
- 1123 Cypress St
- 1117 Cypress St
- 1125 Cypress St
- 1115 Cypress St
- 1118 Stone Ave
- 1120 Stone Ave
- 1129 Cypress St
- 1113 Cypress St
- 1116 Stone Ave
- 1124 Stone Ave
- 1111 Cypress St
- 1126 Stone Ave
- 1137 Cypress St
- 1120 Cypress St
- 1118 Cypress St
- 1122 Cypress St
- 1124 Cypress St
- 1116 Cypress St
- 1112 Stone Ave
- 1109 Cypress St