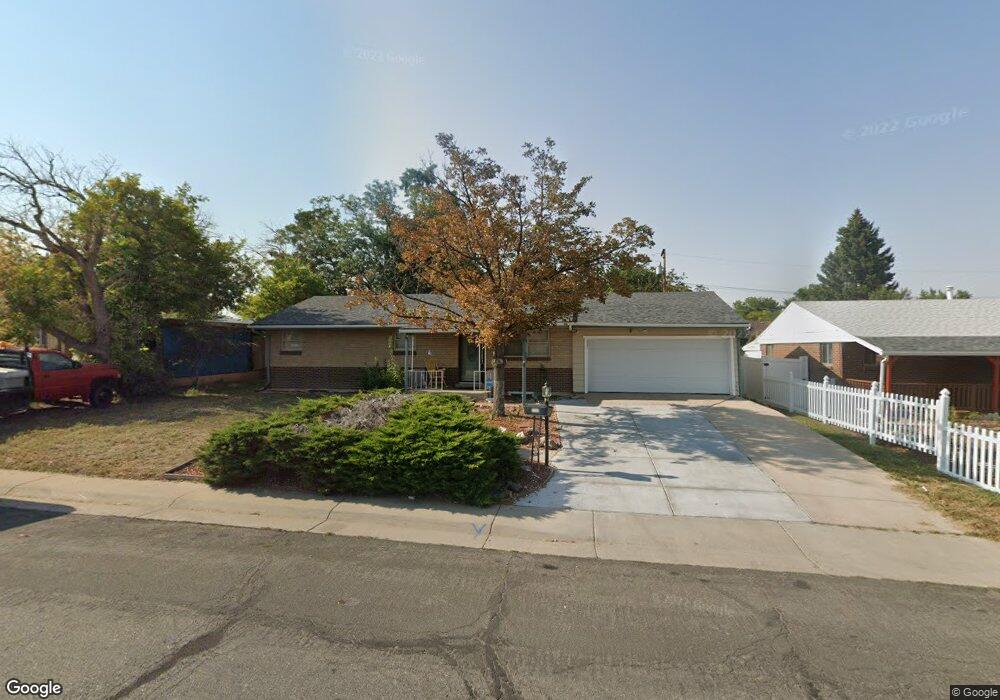
1121 Dakin St Denver, CO 80221
Sherrelwood NeighborhoodEstimated Value: $434,000 - $494,000
4
Beds
2
Baths
2,440
Sq Ft
$187/Sq Ft
Est. Value
About This Home
This home is located at 1121 Dakin St, Denver, CO 80221 and is currently estimated at $457,254, approximately $187 per square foot. 1121 Dakin St is a home located in Adams County with nearby schools including Sherrelwood Elementary School, Iver C. Ranum Middle School, and Westminster High School.
Ownership History
Date
Name
Owned For
Owner Type
Purchase Details
Closed on
May 7, 2009
Sold by
Deutsche Bank National Trust Company
Bought by
Thienhuong Flp
Current Estimated Value
Purchase Details
Closed on
Apr 30, 2009
Sold by
Archibeque Kevin A and Archibeque Sonia M
Bought by
Deutsche Bank National Trust Company
Purchase Details
Closed on
Oct 24, 2000
Sold by
Kent Jimmy L and Kent Pamela J
Bought by
Archibeque Kevin A and Archibeque Sonia M
Home Financials for this Owner
Home Financials are based on the most recent Mortgage that was taken out on this home.
Original Mortgage
$133,000
Interest Rate
10.25%
Create a Home Valuation Report for This Property
The Home Valuation Report is an in-depth analysis detailing your home's value as well as a comparison with similar homes in the area
Home Values in the Area
Average Home Value in this Area
Purchase History
| Date | Buyer | Sale Price | Title Company |
|---|---|---|---|
| Thienhuong Flp | $117,500 | None Available | |
| Deutsche Bank National Trust Company | -- | None Available | |
| Archibeque Kevin A | $173,000 | -- |
Source: Public Records
Mortgage History
| Date | Status | Borrower | Loan Amount |
|---|---|---|---|
| Previous Owner | Archibeque Kevin A | $133,000 |
Source: Public Records
Tax History
| Year | Tax Paid | Tax Assessment Tax Assessment Total Assessment is a certain percentage of the fair market value that is determined by local assessors to be the total taxable value of land and additions on the property. | Land | Improvement |
|---|---|---|---|---|
| 2025 | $3,226 | $30,600 | $6,120 | $24,480 |
| 2024 | $3,226 | $28,130 | $5,630 | $22,500 |
| 2023 | $3,208 | $32,260 | $5,610 | $26,650 |
| 2022 | $2,908 | $24,430 | $5,770 | $18,660 |
| 2021 | $2,975 | $24,430 | $5,770 | $18,660 |
| 2020 | $2,807 | $23,480 | $5,930 | $17,550 |
| 2019 | $2,801 | $23,480 | $5,930 | $17,550 |
| 2018 | $2,222 | $18,530 | $5,620 | $12,910 |
| 2017 | $1,941 | $18,530 | $5,620 | $12,910 |
| 2016 | $1,733 | $15,690 | $3,100 | $12,590 |
| 2015 | $1,731 | $15,690 | $3,100 | $12,590 |
| 2014 | $1,410 | $12,370 | $2,310 | $10,060 |
Source: Public Records
Map
Nearby Homes
- 1281 Mariposa Dr
- 1181 El Paso Blvd
- 1262 Elder St
- 7652 Granada Rd
- 7480 Greenwood Blvd
- 781 Cortez St
- 7488 Quivas St
- 841 Bronco Rd
- 660 Elbert St
- 820 Bronco Rd
- 7883 Greenwood Blvd
- 7798 Quivas St
- 1665 Elmwood Ln
- 7961 Granada Rd
- 7911 Navajo St
- 7889 Pecos St
- 7956 Osage St
- 500 Bronco Rd
- 191 Cortez St
- 7831 Shoshone St
Your Personal Tour Guide
Ask me questions while you tour the home.