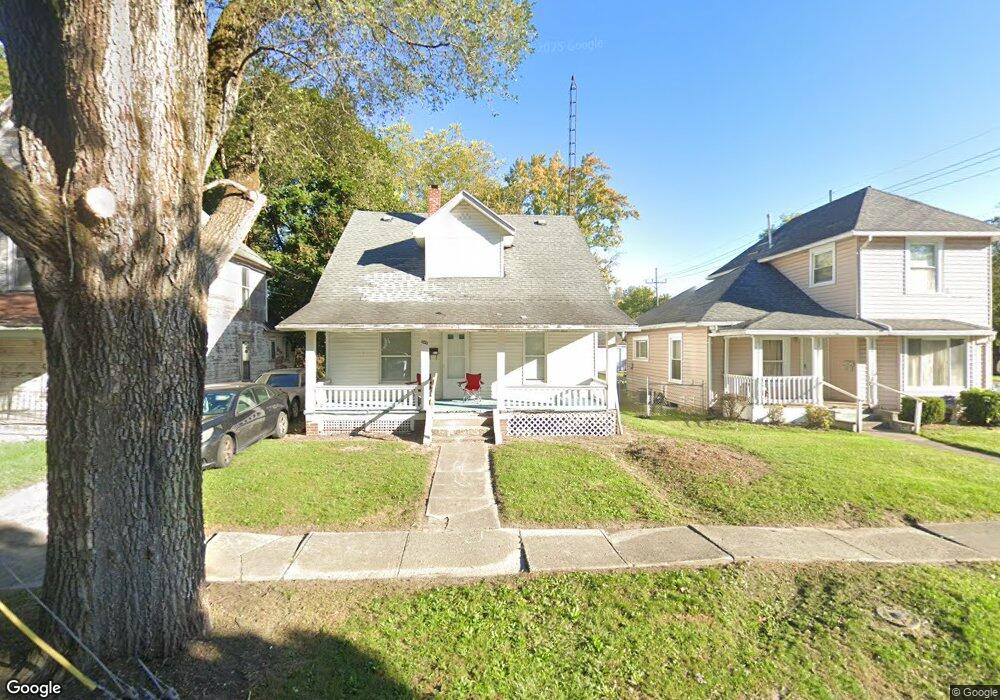
1121 E 2nd St Lima, OH 45804
Southside Lima NeighborhoodEstimated Value: $35,000 - $53,356
4
Beds
1
Bath
1,235
Sq Ft
$38/Sq Ft
Est. Value
About This Home
This home is located at 1121 E 2nd St, Lima, OH 45804 and is currently estimated at $46,839, approximately $37 per square foot. 1121 E 2nd St is a home located in Allen County with nearby schools including Unity Elementary School, Lima North Middle School, and Lima West Middle School.
Ownership History
Date
Name
Owned For
Owner Type
Purchase Details
Closed on
Jan 4, 2024
Sold by
Evans Richard Lee
Bought by
Great Lima Acquistion Group Llc
Current Estimated Value
Purchase Details
Closed on
Dec 6, 2018
Sold by
Pk Investors Llc
Bought by
Evans Richard Lee
Purchase Details
Closed on
Oct 31, 2013
Sold by
Roebuck J Michael and Roebuck Rita
Bought by
Pk Investors Llc
Purchase Details
Closed on
Jan 31, 2001
Sold by
Morgan Dennis L
Bought by
Roebuck J Michael
Purchase Details
Closed on
Feb 1, 1990
Bought by
West Anne
Create a Home Valuation Report for This Property
The Home Valuation Report is an in-depth analysis detailing your home's value as well as a comparison with similar homes in the area
Home Values in the Area
Average Home Value in this Area
Purchase History
| Date | Buyer | Sale Price | Title Company |
|---|---|---|---|
| Great Lima Acquistion Group Llc | $32,500 | None Listed On Document | |
| Evans Richard Lee | $5,000 | None Available | |
| Pk Investors Llc | $27,000 | None Available | |
| Roebuck J Michael | $16,500 | -- | |
| West Anne | $4,000 | -- |
Source: Public Records
Tax History
| Year | Tax Paid | Tax Assessment Tax Assessment Total Assessment is a certain percentage of the fair market value that is determined by local assessors to be the total taxable value of land and additions on the property. | Land | Improvement |
|---|---|---|---|---|
| 2024 | $431 | $10,050 | $1,050 | $9,000 |
| 2023 | $468 | $9,600 | $1,020 | $8,580 |
| 2022 | $470 | $9,600 | $1,020 | $8,580 |
| 2021 | $491 | $9,600 | $1,020 | $8,580 |
| 2020 | $473 | $8,230 | $1,020 | $7,210 |
| 2019 | $473 | $8,230 | $1,020 | $7,210 |
| 2018 | $473 | $8,230 | $1,020 | $7,210 |
| 2017 | $470 | $8,230 | $1,020 | $7,210 |
| 2016 | $482 | $8,230 | $1,020 | $7,210 |
| 2015 | $486 | $8,230 | $1,020 | $7,210 |
| 2014 | $445 | $7,600 | $1,050 | $6,550 |
| 2013 | $465 | $7,600 | $1,050 | $6,550 |
Source: Public Records
Map
Nearby Homes
Your Personal Tour Guide
Ask me questions while you tour the home.