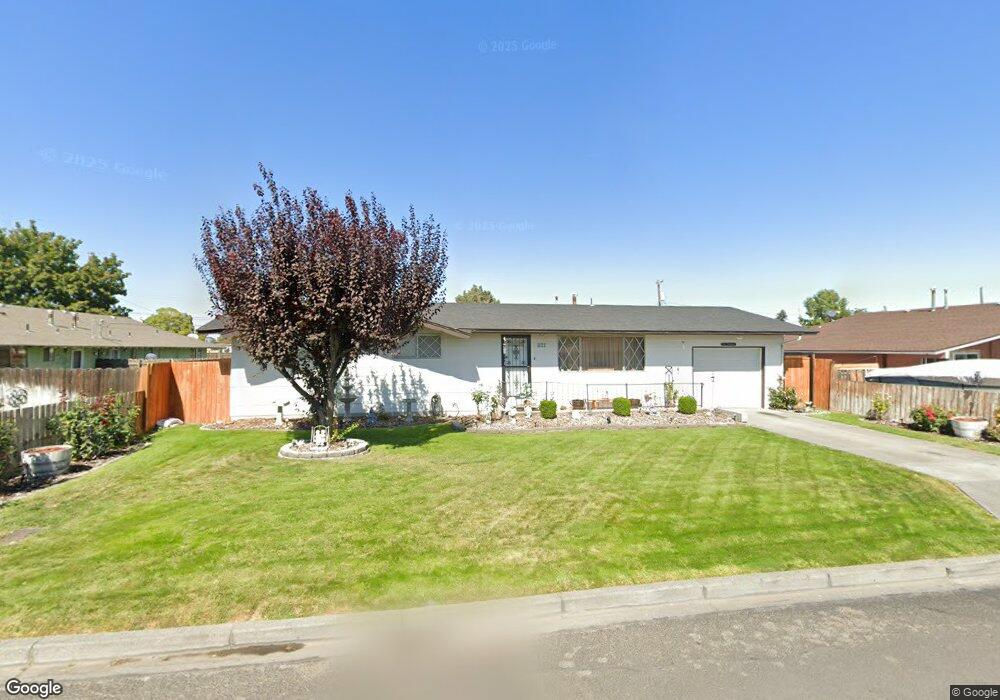
1121 E Ash St Othello, WA 99344
Estimated Value: $270,060 - $341,000
3
Beds
2
Baths
1,196
Sq Ft
$249/Sq Ft
Est. Value
About This Home
This home is located at 1121 E Ash St, Othello, WA 99344 and is currently estimated at $297,765, approximately $248 per square foot. 1121 E Ash St is a home located in Adams County with nearby schools including Othello High School and Liberty Bell Academy.
Ownership History
Date
Name
Owned For
Owner Type
Purchase Details
Closed on
Mar 20, 2017
Sold by
Montejano Betty and Montejano Jose M
Bought by
Montejano Jose M
Current Estimated Value
Home Financials for this Owner
Home Financials are based on the most recent Mortgage that was taken out on this home.
Original Mortgage
$5,753
Outstanding Balance
$4,771
Interest Rate
4.17%
Mortgage Type
Purchase Money Mortgage
Estimated Equity
$292,994
Purchase Details
Closed on
Mar 16, 2017
Sold by
Palmer Karen A and Herrick Cindy J
Bought by
Montejano Jose M
Home Financials for this Owner
Home Financials are based on the most recent Mortgage that was taken out on this home.
Original Mortgage
$5,753
Outstanding Balance
$4,771
Interest Rate
4.17%
Mortgage Type
Purchase Money Mortgage
Estimated Equity
$292,994
Purchase Details
Closed on
Aug 29, 2007
Sold by
Cannell Lavern and Cannell Josephine
Bought by
Palmer Karen A and Herrick Cindy J
Create a Home Valuation Report for This Property
The Home Valuation Report is an in-depth analysis detailing your home's value as well as a comparison with similar homes in the area
Purchase History
| Date | Buyer | Sale Price | Title Company |
|---|---|---|---|
| Montejano Jose M | -- | None Available | |
| Montejano Jose M | $146,500 | Frontier Title Co | |
| Palmer Karen A | -- | None Available |
Source: Public Records
Mortgage History
| Date | Status | Borrower | Loan Amount |
|---|---|---|---|
| Open | Montejano Jose M | $5,753 | |
| Open | Montejano Jose M | $143,846 |
Source: Public Records
Tax History
| Year | Tax Paid | Tax Assessment Tax Assessment Total Assessment is a certain percentage of the fair market value that is determined by local assessors to be the total taxable value of land and additions on the property. | Land | Improvement |
|---|---|---|---|---|
| 2024 | $2,165 | $193,900 | $51,900 | $142,000 |
| 2023 | $2,165 | $178,600 | $48,000 | $130,600 |
| 2022 | $1,991 | $152,000 | $38,400 | $113,600 |
| 2021 | $1,963 | $152,000 | $38,400 | $113,600 |
| 2020 | $1,792 | $143,500 | $38,400 | $105,100 |
| 2019 | $1,670 | $134,700 | $38,400 | $96,300 |
| 2018 | $1,670 | $125,300 | $34,300 | $91,000 |
| 2017 | $1,668 | $125,300 | $34,300 | $91,000 |
Source: Public Records
Map
Nearby Homes
- 925 S 11th Ave
- 1525 E Catalpa St
- 980 Capstone Ave
- 1295 S 7th Ave
- 1315 Gemstone St
- 415 Sylvan Dr
- 1070 S 4th Ave
- 245 E Cedar St
- 205 E Cedar St
- 1205 E Rainier St
- 425 N Desdemona Ave
- 1105 E Olympia St
- 1120 E Mt Adams St
- 550 E Olympia St
- 620 N Larkspur Ln
- 705 E Mt Adams St
- 1209 E Mt Hood St
- 1144 E Mt Hood St
- 1259 E Mt Hood St
- 1124 E Mt Hood St
- 1135 E Ash St
- 631 S 11th Ave Unit 651
- 631 651 S 11th Ave
- 650 S 12th Ave
- 1120 E Oak St
- 1132 E Oak St
- 1110 E Oak St
- 1132 E Ash St
- 1144 E Oak St
- 1138 E Ash St
- 1102 E Ash St
- 1150 E Oak St
- 630 S 11th Ave Unit 650
- 700 S 12th Ave
- 600 S 11th Ave Unit 610
- 600 610 S 11th Ave
- 1040 E Ash St
- 651 S 12th Ave
- 1035 E Ash St
- 615 S 12th Ave
Your Personal Tour Guide
Ask me questions while you tour the home.