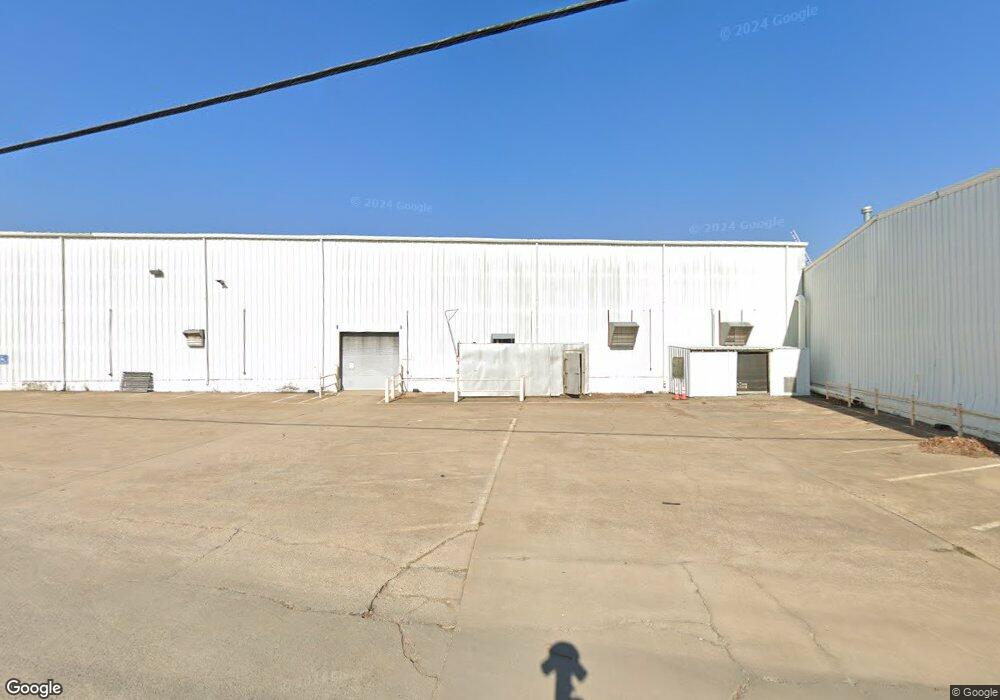
1121 E Jefferson St Siloam Springs, AR 72761
Estimated Value: $773,714
--
Bed
--
Bath
93,943
Sq Ft
$8/Sq Ft
Est. Value
About This Home
This home is located at 1121 E Jefferson St, Siloam Springs, AR 72761 and is currently estimated at $773,714, approximately $8 per square foot. 1121 E Jefferson St is a home located in Benton County with nearby schools including Northside Elementary School, Southside Elementary School, and Delbert Pete & Pat Allen Elementary School.
Ownership History
Date
Name
Owned For
Owner Type
Purchase Details
Closed on
Feb 18, 2025
Sold by
Shiloh Warehouse Space Llc
Bought by
Vito Groups Llc
Current Estimated Value
Home Financials for this Owner
Home Financials are based on the most recent Mortgage that was taken out on this home.
Original Mortgage
$2,281,594
Outstanding Balance
$1,870,153
Interest Rate
6.14%
Mortgage Type
New Conventional
Estimated Equity
-$1,096,439
Purchase Details
Closed on
Feb 25, 2014
Sold by
Allens Inc
Bought by
1121 East Jefferson Street Holdings Llc
Home Financials for this Owner
Home Financials are based on the most recent Mortgage that was taken out on this home.
Original Mortgage
$66,043,967
Interest Rate
4.36%
Purchase Details
Closed on
Jan 18, 1987
Bought by
Allen
Purchase Details
Closed on
Nov 26, 1957
Bought by
Allen Foods
Create a Home Valuation Report for This Property
The Home Valuation Report is an in-depth analysis detailing your home's value as well as a comparison with similar homes in the area
Home Values in the Area
Average Home Value in this Area
Purchase History
| Date | Buyer | Sale Price | Title Company |
|---|---|---|---|
| Vito Groups Llc | $3,000,000 | City Title | |
| 1121 East Jefferson Street Holdings Llc | $1,854,500 | Waco | |
| Allen | -- | -- | |
| Allen Foods | $40,000 | -- |
Source: Public Records
Mortgage History
| Date | Status | Borrower | Loan Amount |
|---|---|---|---|
| Open | Vito Groups Llc | $2,281,594 | |
| Previous Owner | 1121 East Jefferson Street Holdings Llc | $66,043,967 | |
| Previous Owner | 1121 East Jefferson Street Holdings Llc | $32,000,000 |
Source: Public Records
Tax History Compared to Growth
Tax History
| Year | Tax Paid | Tax Assessment Tax Assessment Total Assessment is a certain percentage of the fair market value that is determined by local assessors to be the total taxable value of land and additions on the property. | Land | Improvement |
|---|---|---|---|---|
| 2025 | $6,891 | $149,606 | $17,907 | $131,699 |
| 2024 | $6,483 | $149,606 | $17,907 | $131,699 |
| 2023 | $5,894 | $102,330 | $14,100 | $88,230 |
| 2022 | $5,889 | $102,330 | $14,100 | $88,230 |
| 2021 | $5,875 | $102,330 | $14,100 | $88,230 |
| 2020 | $5,565 | $96,620 | $14,100 | $82,520 |
| 2019 | $10,392 | $181,720 | $15,400 | $166,320 |
| 2018 | $10,467 | $181,720 | $15,400 | $166,320 |
| 2017 | $10,467 | $181,720 | $15,400 | $166,320 |
| 2016 | $10,467 | $181,720 | $15,400 | $166,320 |
| 2015 | $12,560 | $218,050 | $15,640 | $202,410 |
| 2014 | $12,560 | $218,050 | $15,640 | $202,410 |
Source: Public Records
Map
Nearby Homes
- TBD E Main St
- 1.94 AC Lot 2 S Britt St
- 3 AC Lot 1 S Britt St
- 4.94 AC Lots 1 & 2 S Britt St
- 624 S Hico St
- 1112 E Harvard St
- 704 S Hico St
- 814 S Inglewood St
- 721 S Lincoln St
- 110 N Gunter St
- 515 S Washington St
- 509 S Washington St
- 607 E Delaware St
- 101 E Central St
- 716 S Washington St
- 882 S Lincoln St
- 506 E Ashley St
- 403 E University St
- 0 Tbd St Andrews
- 201 N Country Club Rd
- . E Jefferson St
- 0 E Jefferson St
- 517 S Hico St
- Lot 1B E Main St
- Lot 1A E Main St
- 519 S Hico St
- E E Main St
- 911 E Jefferson St
- 930 E Jefferson St
- 820 E Delaware St
- 604 S Hico St
- 875 E Jefferson St
- 0 E Main St Unit 550818
- 0 E Main St Unit 1015938
- 0 E Main St Unit 1072321
- 0 E Main St Unit 1101856
- 0 E Main St Unit 1096941
- 818 E Delaware St
- TBD S Gunter St
- 1333 E Main St