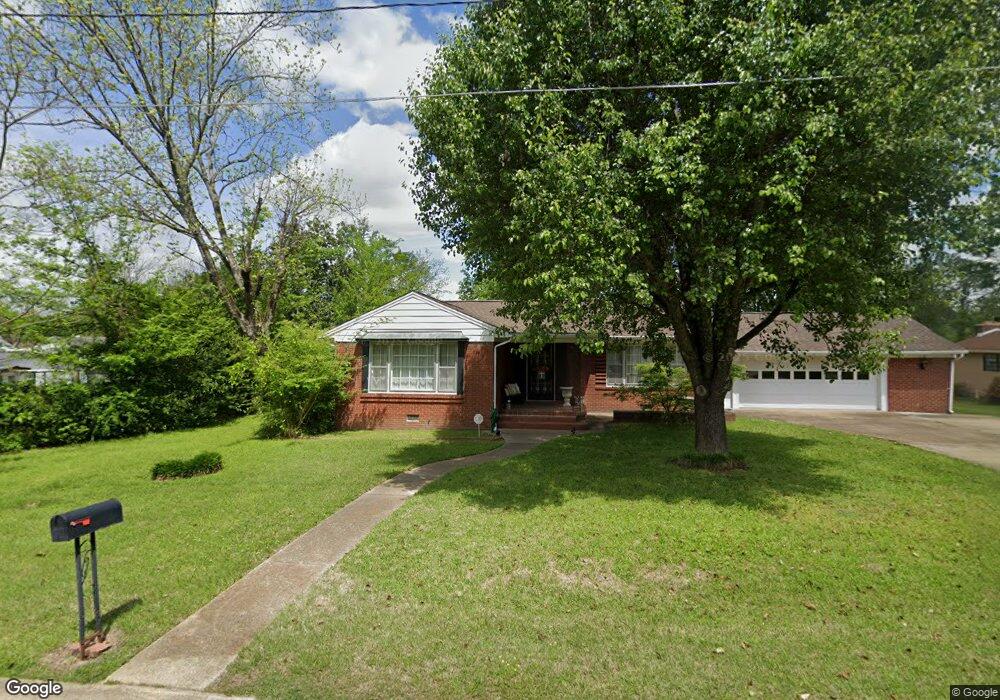
1121 E Jordan Avenue Extension West Point, MS 39773
Estimated Value: $152,209 - $177,000
3
Beds
--
Bath
1,912
Sq Ft
$87/Sq Ft
Est. Value
About This Home
This home is located at 1121 E Jordan Avenue Extension, West Point, MS 39773 and is currently estimated at $166,052, approximately $86 per square foot. 1121 E Jordan Avenue Extension is a home located in Clay County with nearby schools including East Side Elementary School, West Clay Elementary School, and Church Hill Elementary School.
Ownership History
Date
Name
Owned For
Owner Type
Purchase Details
Closed on
Nov 30, 2017
Sold by
Discon Donald J and Discon Virginia T
Bought by
Lippincott Susan
Current Estimated Value
Home Financials for this Owner
Home Financials are based on the most recent Mortgage that was taken out on this home.
Original Mortgage
$118,250
Outstanding Balance
$116,593
Interest Rate
3.94%
Mortgage Type
Purchase Money Mortgage
Estimated Equity
$49,459
Purchase Details
Closed on
May 24, 2012
Sold by
Higgins Kathleen L
Bought by
Discon Don and Discon Virginia T
Create a Home Valuation Report for This Property
The Home Valuation Report is an in-depth analysis detailing your home's value as well as a comparison with similar homes in the area
Home Values in the Area
Average Home Value in this Area
Purchase History
| Date | Buyer | Sale Price | Title Company |
|---|---|---|---|
| Lippincott Susan | -- | -- | |
| Discon Don | -- | -- |
Source: Public Records
Mortgage History
| Date | Status | Borrower | Loan Amount |
|---|---|---|---|
| Open | Lippincott Susan | $118,250 |
Source: Public Records
Tax History Compared to Growth
Tax History
| Year | Tax Paid | Tax Assessment Tax Assessment Total Assessment is a certain percentage of the fair market value that is determined by local assessors to be the total taxable value of land and additions on the property. | Land | Improvement |
|---|---|---|---|---|
| 2024 | $434 | $10,760 | $2,229 | $8,531 |
| 2023 | $1,072 | $9,164 | $2,229 | $6,935 |
| 2022 | $350 | $9,164 | $2,229 | $6,935 |
| 2021 | $346 | $9,164 | $2,229 | $6,935 |
| 2020 | $348 | $9,164 | $2,229 | $6,935 |
| 2019 | $317 | $9,099 | $2,229 | $6,870 |
| 2018 | $301 | $9,099 | $2,229 | $6,870 |
| 2017 | $79 | $9,099 | $2,229 | $6,870 |
| 2016 | $78 | $9,099 | $2,229 | $6,870 |
| 2015 | $44 | $8,384 | $2,229 | $6,155 |
| 2014 | $47 | $8,384 | $2,229 | $6,155 |
| 2013 | $47 | $8,384 | $2,229 | $6,155 |
Source: Public Records
Map
Nearby Homes
- 1124 N Eshman Ave
- 27445 E Main St
- 27045 E Main St
- 1180 E Broad St
- 26596 E Main St
- 1153 E Broad St
- 551 E Westbrook St
- 1104 E Broad St
- 485 E Westbrook St
- 480 E Westbrook St
- 479 E Westbrook St
- 26852 E Main St
- 472 S Eshman Ave
- 278 Converse Dr
- 26788 E Main St
- 329 Converse Dr
- 44 Torbert Dr
- 564 E Morrow St
- 530 E Morrow St
- 1046 E Brame Ave
- 1125 E Jordan Avenue Extension
- 134 Mccord St
- 124 Mccord St
- 1124 E Jordan Avenue Extension
- 1151 Durrett Cove
- 204 Mccord St
- 556 Mccord St
- 112 Mccord St
- 1153 Durrett Cove
- 214 Mccord St
- 123 S Eshman Ave
- 1066 E Main St
- 1154 Durrett Cove
- 27240 E Main St
- 221 N Eshman Ave
- 139 Mccord St
- 1115 E Broad St
- 891 S Eshman Ave
- 545 Mccord St
- 1135 E Broad St