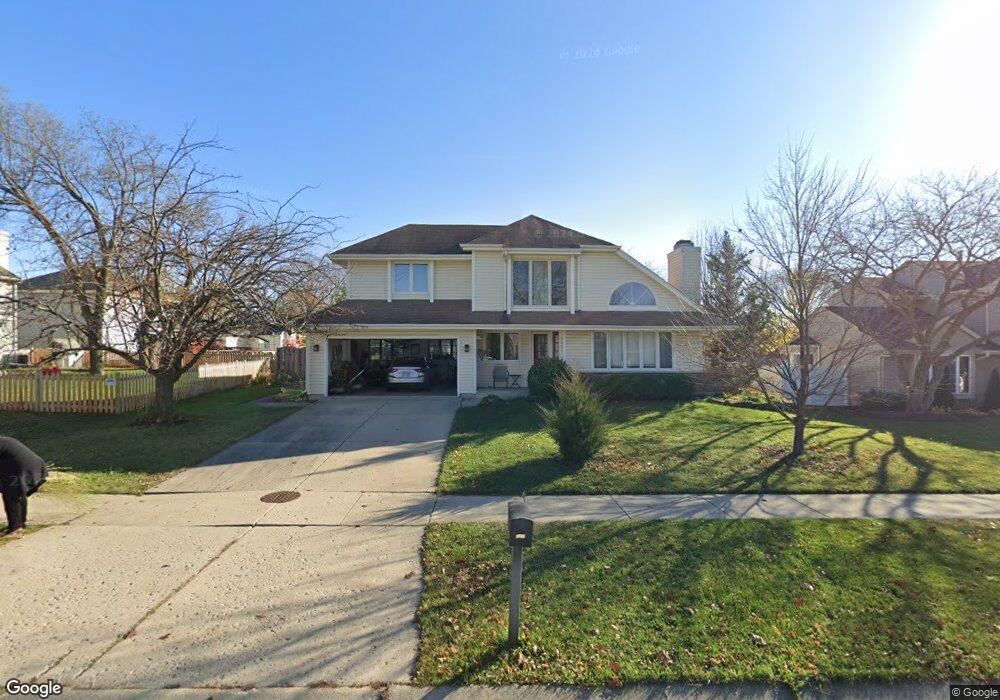
1121 Emerald Dr Aurora, IL 60506
Edgelawn Randall NeighborhoodEstimated Value: $374,938 - $442,000
2
Beds
2
Baths
1,913
Sq Ft
$213/Sq Ft
Est. Value
About This Home
This home is located at 1121 Emerald Dr, Aurora, IL 60506 and is currently estimated at $407,235, approximately $212 per square foot. 1121 Emerald Dr is a home located in Kane County with nearby schools including Hall Elementary School, Jefferson Middle School, and West Aurora High School.
Ownership History
Date
Name
Owned For
Owner Type
Purchase Details
Closed on
Aug 27, 2012
Sold by
Macvicar James and Macvicar Linda
Bought by
Powers Dolores R
Current Estimated Value
Home Financials for this Owner
Home Financials are based on the most recent Mortgage that was taken out on this home.
Original Mortgage
$122,000
Outstanding Balance
$84,140
Interest Rate
3.5%
Mortgage Type
New Conventional
Estimated Equity
$323,095
Purchase Details
Closed on
Jul 16, 2004
Sold by
Wilson Beth A and Wilson Tim A
Bought by
Macvicar James and Macvicar Linda
Purchase Details
Closed on
Jun 28, 1996
Sold by
Lipa Robert
Bought by
Lowney Beth A and Wilson Tim A
Home Financials for this Owner
Home Financials are based on the most recent Mortgage that was taken out on this home.
Original Mortgage
$135,600
Interest Rate
8.31%
Create a Home Valuation Report for This Property
The Home Valuation Report is an in-depth analysis detailing your home's value as well as a comparison with similar homes in the area
Home Values in the Area
Average Home Value in this Area
Purchase History
| Date | Buyer | Sale Price | Title Company |
|---|---|---|---|
| Powers Dolores R | $152,500 | First American Title | |
| Macvicar James | $237,000 | -- | |
| Lowney Beth A | $151,000 | -- |
Source: Public Records
Mortgage History
| Date | Status | Borrower | Loan Amount |
|---|---|---|---|
| Open | Powers Dolores R | $122,000 | |
| Previous Owner | Lowney Beth A | $135,600 |
Source: Public Records
Tax History
| Year | Tax Paid | Tax Assessment Tax Assessment Total Assessment is a certain percentage of the fair market value that is determined by local assessors to be the total taxable value of land and additions on the property. | Land | Improvement |
|---|---|---|---|---|
| 2024 | $7,897 | $115,729 | $15,912 | $99,817 |
| 2023 | $7,486 | $103,403 | $14,217 | $89,186 |
| 2022 | $7,378 | $94,346 | $12,972 | $81,374 |
| 2021 | $7,044 | $88,101 | $12,077 | $76,024 |
| 2020 | $6,631 | $81,833 | $11,218 | $70,615 |
| 2019 | $6,689 | $79,402 | $10,394 | $69,008 |
| 2018 | $6,086 | $71,962 | $9,614 | $62,348 |
| 2017 | $6,677 | $75,877 | $8,858 | $67,019 |
| 2016 | $5,750 | $65,121 | $7,593 | $57,528 |
| 2015 | -- | $55,147 | $6,529 | $48,618 |
| 2014 | -- | $52,746 | $6,279 | $46,467 |
| 2013 | -- | $51,995 | $6,190 | $45,805 |
Source: Public Records
Map
Nearby Homes
- 980 Sapphire Ln
- 968 Sapphire Ln
- 960 Sapphire Ln
- 972 Sapphire Ln
- 988 Sapphire Ln
- 976 Sapphire Ln
- 984 Sapphire Ln
- 991 Sapphire Ln
- 959 Sapphire Ln
- 975 Sapphire Ln
- 963 Sapphire Ln
- 987 Sapphire Ln
- 1086 Cascade Dr Unit 1
- 1930 Richard St Unit 1
- 1295 Foxcroft Dr
- 1322 Croton Ct Unit A
- 1071 Almond Dr
- 1475 Elder Dr
- 1480 Colorado Ave
- 2140 Sandburg Dr
- 1111 Emerald Dr
- 1920 Sapphire Ln
- 1050 Cypress Dr
- 1046 Cypress Dr
- 1101 Emerald Dr
- 1910 Sapphire Ln
- 1130 Emerald Dr Unit 9
- 1042 Cypress Dr
- 1110 Emerald Dr
- 1940 Sapphire Ln Unit 9
- 1091 Emerald Dr
- 1038 Cypress Dr
- 1100 Emerald Dr
- 1921 Sapphire Ln
- 1911 Sapphire Ln
- 1081 Emerald Dr Unit 9
- 1900 Sapphire Ln
- 1121 Cochran St
- 1131 Cochran St
- 1051 Cypress Dr
Your Personal Tour Guide
Ask me questions while you tour the home.