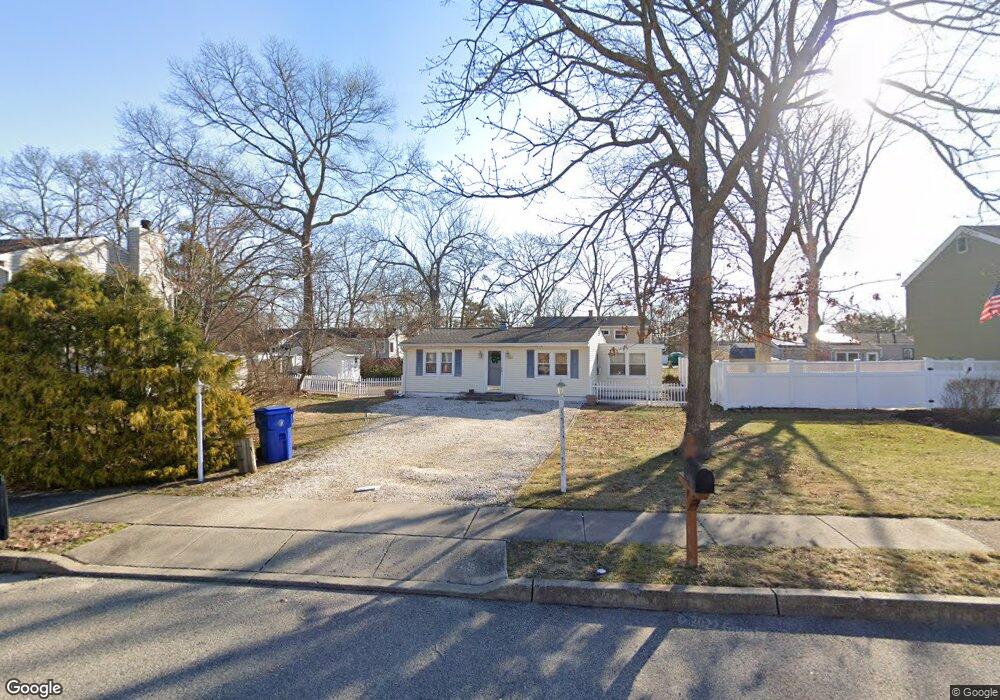
1121 Kenton Dr Toms River, NJ 08753
Estimated Value: $362,000 - $401,000
2
Beds
1
Bath
864
Sq Ft
$443/Sq Ft
Est. Value
About This Home
This home is located at 1121 Kenton Dr, Toms River, NJ 08753 and is currently estimated at $382,833, approximately $443 per square foot. 1121 Kenton Dr is a home located in Ocean County.
Ownership History
Date
Name
Owned For
Owner Type
Purchase Details
Closed on
Nov 15, 2004
Sold by
Sheperd Irene
Bought by
Fecanin Mary Ellen
Current Estimated Value
Home Financials for this Owner
Home Financials are based on the most recent Mortgage that was taken out on this home.
Original Mortgage
$169,500
Outstanding Balance
$84,699
Interest Rate
5.8%
Mortgage Type
Fannie Mae Freddie Mac
Estimated Equity
$298,134
Purchase Details
Closed on
May 18, 2004
Sold by
Edwards Phillip and Edwards Marianne
Bought by
Shepherd Irene
Home Financials for this Owner
Home Financials are based on the most recent Mortgage that was taken out on this home.
Original Mortgage
$147,155
Interest Rate
5.94%
Mortgage Type
Stand Alone First
Purchase Details
Closed on
Sep 20, 1994
Sold by
Wilson Frances
Bought by
Richenburg James
Home Financials for this Owner
Home Financials are based on the most recent Mortgage that was taken out on this home.
Original Mortgage
$59,000
Interest Rate
8.55%
Create a Home Valuation Report for This Property
The Home Valuation Report is an in-depth analysis detailing your home's value as well as a comparison with similar homes in the area
Home Values in the Area
Average Home Value in this Area
Purchase History
| Date | Buyer | Sale Price | Title Company |
|---|---|---|---|
| Fecanin Mary Ellen | $199,500 | Fidelity Natl Title Ins Co | |
| Shepherd Irene | $154,900 | Commonwealth Land Title Insu | |
| Richenburg James | $65,000 | -- |
Source: Public Records
Mortgage History
| Date | Status | Borrower | Loan Amount |
|---|---|---|---|
| Open | Fecanin Mary Ellen | $169,500 | |
| Previous Owner | Shepherd Irene | $147,155 | |
| Previous Owner | Richenburg James | $59,000 |
Source: Public Records
Tax History Compared to Growth
Tax History
| Year | Tax Paid | Tax Assessment Tax Assessment Total Assessment is a certain percentage of the fair market value that is determined by local assessors to be the total taxable value of land and additions on the property. | Land | Improvement |
|---|---|---|---|---|
| 2025 | $4,427 | $243,100 | $118,000 | $125,100 |
| 2024 | $4,208 | $243,100 | $118,000 | $125,100 |
| 2023 | $4,057 | $243,100 | $118,000 | $125,100 |
| 2022 | $4,057 | $243,100 | $118,000 | $125,100 |
| 2021 | $3,783 | $151,000 | $97,000 | $54,000 |
| 2020 | $3,766 | $151,000 | $97,000 | $54,000 |
| 2019 | $3,603 | $151,000 | $97,000 | $54,000 |
| 2018 | $3,555 | $151,000 | $97,000 | $54,000 |
| 2017 | $3,524 | $151,000 | $97,000 | $54,000 |
| 2016 | $3,432 | $151,000 | $97,000 | $54,000 |
| 2015 | $3,302 | $151,000 | $97,000 | $54,000 |
| 2014 | $3,144 | $151,000 | $97,000 | $54,000 |
Source: Public Records
Map
Nearby Homes
- 1083 Crystal Dr
- 1145 Kenton Dr
- 1149 Laurel Dr
- 1088 Kells Ct
- 1171 Laurel Dr
- 890 Fairview Dr
- 141 Yellowbank Rd
- 1099 Fairview Dr
- 367 Flaam St
- 1939 Ship Ct
- 1035 Tralee Dr
- 1841 Starboard Ct
- 912 New Jersey Ave
- 1943 Pinta Ct
- 921 Tudor Dr
- 1090 Westlake Dr
- 1050 Sheila Dr
- 5 Dublin Ct
- 893 New Jersey Ave
- 944 Yellowbank Rd