Estimated Value: $163,196
Studio
--
Bath
3,464
Sq Ft
$47/Sq Ft
Est. Value
About This Home
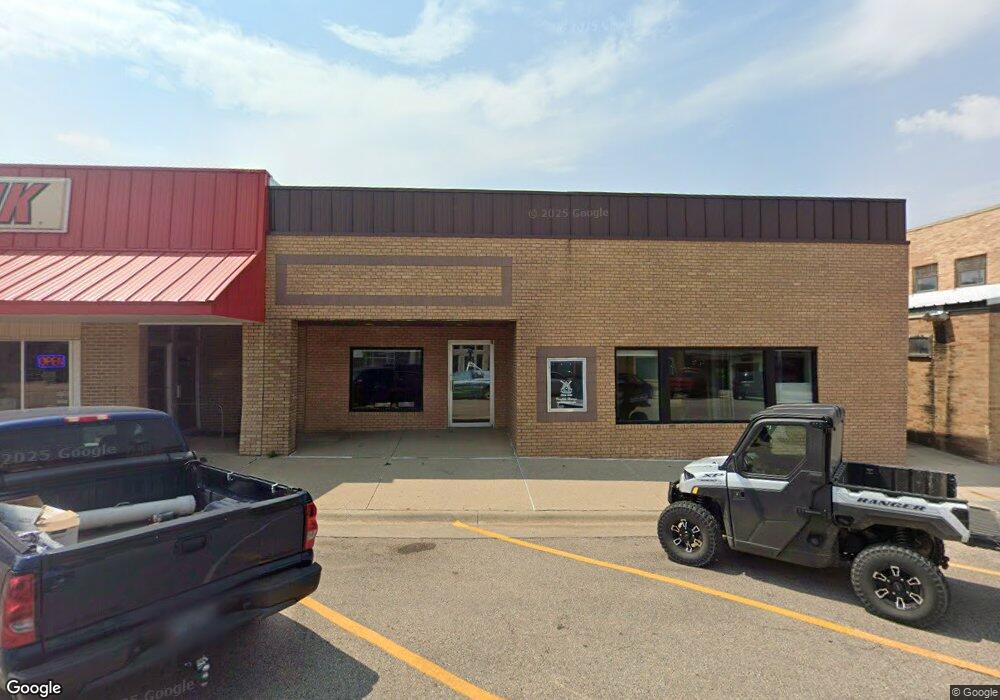
This home is located at 1121 Main St, Hull, IA 51239 and is currently estimated at $163,196, approximately $47 per square foot. 1121 Main St is a home located in Sioux County with nearby schools including Boyden-Hull Elementary School, Boyden-Hull High School, and Hull Christian School.
Ownership History
Date
Name
Owned For
Owner Type
Purchase Details
Closed on
Nov 14, 2025
Sold by
Andringa Shawn A and Andringa Stacy M
Bought by
Shawn A And Stacy M Andringa Revocable Trust and Andringa
Current Estimated Value
Purchase Details
Closed on
Jul 19, 2019
Sold by
R & M Props
Bought by
Andringa Shawn A and Andringa Stacy M
Home Financials for this Owner
Home Financials are based on the most recent Mortgage that was taken out on this home.
Original Mortgage
$92,500
Interest Rate
3.8%
Mortgage Type
Balloon
Create a Home Valuation Report for This Property
The Home Valuation Report is an in-depth analysis detailing your home's value as well as a comparison with similar homes in the area
Purchase History
| Date | Buyer | Sale Price | Title Company |
|---|---|---|---|
| Shawn A And Stacy M Andringa Revocable Trust | -- | None Listed On Document | |
| Andringa Shawn A | -- | -- |
Source: Public Records
Mortgage History
| Date | Status | Borrower | Loan Amount |
|---|---|---|---|
| Previous Owner | Andringa Shawn A | $92,500 |
Source: Public Records
Tax History
| Year | Tax Paid | Tax Assessment Tax Assessment Total Assessment is a certain percentage of the fair market value that is determined by local assessors to be the total taxable value of land and additions on the property. | Land | Improvement |
|---|---|---|---|---|
| 2025 | $2,846 | $207,040 | $22,800 | $184,240 |
| 2024 | $2,846 | $169,720 | $22,800 | $146,920 |
| 2023 | $2,818 | $169,720 | $22,800 | $146,920 |
| 2022 | $2,596 | $148,290 | $11,400 | $136,890 |
| 2021 | $2,730 | $150,270 | $11,400 | $138,870 |
| 2020 | $2,730 | $150,270 | $11,400 | $138,870 |
| 2019 | $2,764 | $150,270 | $11,400 | $138,870 |
| 2018 | $2,822 | $150,270 | $11,400 | $138,870 |
| 2017 | $2,822 | $150,270 | $11,400 | $138,870 |
| 2014 | $2,494 | $134,190 | $0 | $0 |
Source: Public Records
Map
Nearby Homes
- 1013 Walnut St
- 1208 2nd St
- 1219 3rd St
- 423 Railroad St
- 1502 2nd St
- 1509 Birch St
- 1311 Aspen St
- 301 Black Forest Rd
- 2014 Maple St
- 3451 Jackson Ave
- 3585 Ironwood Ave
- 3920 310th St
- 408 Grove St
- 1003 Horizon Rd
- 707 Colfax St
- 1026 15th St Cir NE
- 936 14th Street Cir NE
- 1303 11th Ave NE
- 2629 Warren Cir
- 1093 12th St NE
Your Personal Tour Guide
Ask me questions while you tour the home.