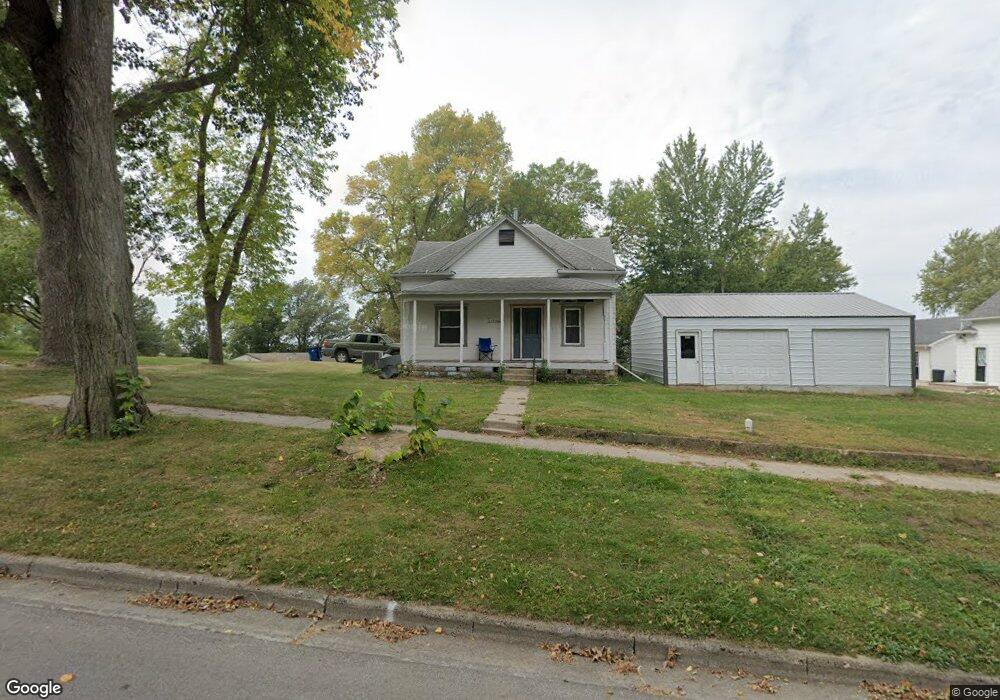
1121 Main St Manning, IA 51455
Estimated Value: $97,000 - $151,000
3
Beds
1
Bath
1,344
Sq Ft
$90/Sq Ft
Est. Value
About This Home
This home is located at 1121 Main St, Manning, IA 51455 and is currently estimated at $121,489, approximately $90 per square foot. 1121 Main St is a home with nearby schools including Ikm-Manning High School, IKM-Manning Middle School, and Irwin Elementary School.
Ownership History
Date
Name
Owned For
Owner Type
Purchase Details
Closed on
Jun 30, 2006
Sold by
Wade Jonna M and Reiter Jonna M
Bought by
Irlmeier Jason
Current Estimated Value
Home Financials for this Owner
Home Financials are based on the most recent Mortgage that was taken out on this home.
Original Mortgage
$624,000
Outstanding Balance
$377,563
Interest Rate
7%
Mortgage Type
Future Advance Clause Open End Mortgage
Estimated Equity
-$256,074
Purchase Details
Closed on
May 15, 2003
Sold by
Holdsworth Clarion and Holdsworth Melvin G
Bought by
Reiter Joel and Reiter Jonna
Create a Home Valuation Report for This Property
The Home Valuation Report is an in-depth analysis detailing your home's value as well as a comparison with similar homes in the area
Home Values in the Area
Average Home Value in this Area
Purchase History
| Date | Buyer | Sale Price | Title Company |
|---|---|---|---|
| Irlmeier Jason | $30,000 | Security Title & Investment | |
| Reiter Joel | $16,000 | Security Title & Investment |
Source: Public Records
Mortgage History
| Date | Status | Borrower | Loan Amount |
|---|---|---|---|
| Open | Irlmeier Jason | $624,000 |
Source: Public Records
Tax History Compared to Growth
Tax History
| Year | Tax Paid | Tax Assessment Tax Assessment Total Assessment is a certain percentage of the fair market value that is determined by local assessors to be the total taxable value of land and additions on the property. | Land | Improvement |
|---|---|---|---|---|
| 2025 | $774 | $73,780 | $17,860 | $55,920 |
| 2024 | $736 | $62,880 | $17,860 | $45,020 |
| 2023 | $916 | $62,880 | $17,860 | $45,020 |
| 2022 | $622 | $63,810 | $12,690 | $51,120 |
| 2021 | $622 | $46,850 | $12,690 | $34,160 |
| 2020 | $350 | $29,720 | $12,690 | $17,030 |
| 2019 | $294 | $29,720 | $12,690 | $17,030 |
| 2018 | $278 | $29,720 | $12,690 | $17,030 |
| 2017 | $278 | $25,498 | $9,962 | $15,536 |
| 2016 | $250 | $23,830 | $0 | $0 |
| 2015 | $250 | $22,210 | $0 | $0 |
| 2014 | $226 | $22,210 | $0 | $0 |
Source: Public Records
Map
Nearby Homes