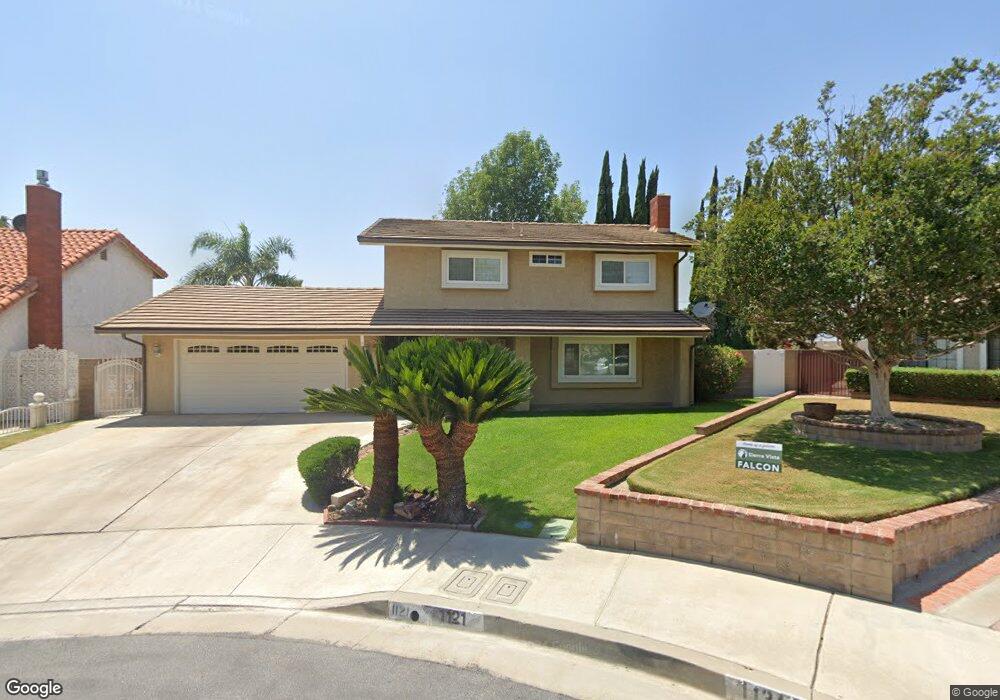
1121 N Langham Ave Covina, CA 91724
Estimated Value: $890,000 - $969,450
3
Beds
3
Baths
2,159
Sq Ft
$428/Sq Ft
Est. Value
About This Home
This home is located at 1121 N Langham Ave, Covina, CA 91724 and is currently estimated at $924,363, approximately $428 per square foot. 1121 N Langham Ave is a home located in Los Angeles County with nearby schools including Cedargrove Elementary School, Royal Oak Middle School, and Charter Oak High School.
Ownership History
Date
Name
Owned For
Owner Type
Purchase Details
Closed on
Jan 12, 2022
Sold by
Ramirez Verenice and Ramirez Eman
Bought by
Ramirez Verenice and Momenzadeh Eman
Current Estimated Value
Purchase Details
Closed on
Jul 23, 2003
Sold by
Connen Catherine A and The Douglas L Abell Revocable
Bought by
Johnson Michael
Home Financials for this Owner
Home Financials are based on the most recent Mortgage that was taken out on this home.
Original Mortgage
$322,700
Interest Rate
5.13%
Mortgage Type
Purchase Money Mortgage
Purchase Details
Closed on
Feb 13, 2002
Sold by
Abell Douglas L
Bought by
Abell Douglas L and Douglas L Abell Revocable Trus
Purchase Details
Closed on
Mar 10, 2000
Sold by
Abell Douglas and Abell Douglas L
Bought by
Abell Douglas L
Home Financials for this Owner
Home Financials are based on the most recent Mortgage that was taken out on this home.
Original Mortgage
$200,000
Interest Rate
8%
Create a Home Valuation Report for This Property
The Home Valuation Report is an in-depth analysis detailing your home's value as well as a comparison with similar homes in the area
Home Values in the Area
Average Home Value in this Area
Purchase History
| Date | Buyer | Sale Price | Title Company |
|---|---|---|---|
| Ramirez Verenice | -- | First American Title Company O | |
| Johnson Michael | $415,000 | Fidelity | |
| Abell Douglas L | -- | -- | |
| Abell Douglas L | -- | Fidelity National Title Co |
Source: Public Records
Mortgage History
| Date | Status | Borrower | Loan Amount |
|---|---|---|---|
| Previous Owner | Johnson Michael | $322,700 | |
| Previous Owner | Abell Douglas L | $200,000 | |
| Closed | Johnson Michael | $75,000 |
Source: Public Records
Tax History Compared to Growth
Tax History
| Year | Tax Paid | Tax Assessment Tax Assessment Total Assessment is a certain percentage of the fair market value that is determined by local assessors to be the total taxable value of land and additions on the property. | Land | Improvement |
|---|---|---|---|---|
| 2025 | $7,163 | $590,022 | $302,119 | $287,903 |
| 2024 | $7,163 | $578,454 | $296,196 | $282,258 |
| 2023 | $6,994 | $567,113 | $290,389 | $276,724 |
| 2022 | $6,911 | $555,995 | $284,696 | $271,299 |
| 2021 | $6,810 | $545,094 | $279,114 | $265,980 |
| 2019 | $6,665 | $528,929 | $270,837 | $258,092 |
| 2018 | $6,318 | $518,559 | $265,527 | $253,032 |
| 2016 | $6,030 | $498,424 | $255,217 | $243,207 |
| 2015 | $6,002 | $490,938 | $251,384 | $239,554 |
| 2014 | $5,986 | $481,322 | $246,460 | $234,862 |
Source: Public Records
Map
Nearby Homes
- 1158 N Ivescrest Ave
- 19850 E Arrow Hwy Unit E-9
- 19850 E Arrow Hwy Unit C8
- 19850 E Arrow Hwy Unit E5
- 904 N Bender Ave
- 4900 N Grand Ave Unit 220
- 4900 N Grand Ave Unit 131
- 4900 N Grand Ave Unit 342
- 19555 E Cypress St Unit P
- 20232 E Arrow Hwy Unit A
- 5020 N Bonnie Cove Ave
- 19531 E Cienega Ave
- 299 E Arrow Hwy Unit 4
- 1700 S Glendora Ave Unit 40
- 1700 S Glendora Ave Unit 43
- 1735 S Banna Ave
- 19548 E Cypress St Unit 3
- 19548 E Cypress St Unit 17
- 19548 E Cypress St Unit 33
- 5035 N Reeder Ave
- 1131 N Langham Ave
- 1111 N Langham Ave
- 1126 N Glendora Ave
- 1118 N Glendora Ave
- 1134 N Glendora Ave
- 1132 N Langham Ave
- 1315 E Covina Blvd
- 1101 N Langham Ave
- 1122 N Langham Ave
- 1112 N Langham Ave
- 1332 E Tudor St
- 1324 E Tudor St
- 1305 E Covina Blvd
- 1144 N Glendora Ave
- 1340 E Tudor St
- 1102 N Langham Ave
- 1143 N Ivescrest Ave
- 1152 N Glendora Ave
- 1151 N Ivescrest Ave
- 1162 N Glendora Ave