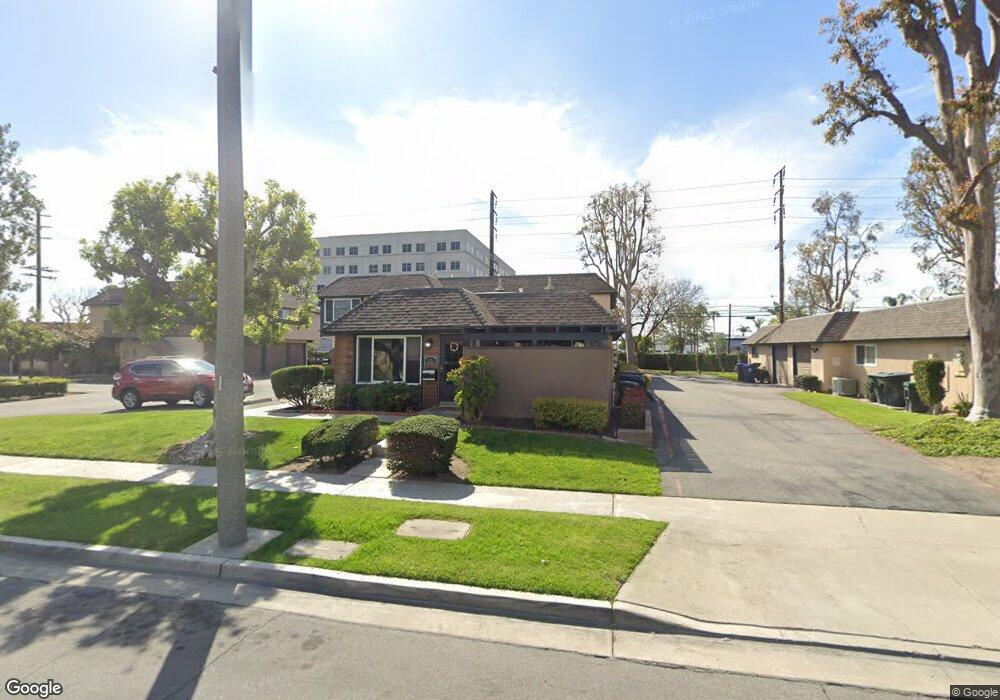
1121 S Clifpark Cir Unit 3C Anaheim, CA 92805
Southeast Anaheim NeighborhoodEstimated Value: $601,000 - $650,000
3
Beds
2
Baths
1,118
Sq Ft
$559/Sq Ft
Est. Value
About This Home
This home is located at 1121 S Clifpark Cir Unit 3C, Anaheim, CA 92805 and is currently estimated at $624,527, approximately $558 per square foot. 1121 S Clifpark Cir Unit 3C is a home located in Orange County with nearby schools including Theodore Roosevelt Elementary School, South Junior High School, and Katella High School.
Ownership History
Date
Name
Owned For
Owner Type
Purchase Details
Closed on
Aug 31, 2009
Sold by
Chase Merritt Fund I Llc
Bought by
Ace Asset Leasing Llc
Current Estimated Value
Purchase Details
Closed on
Aug 20, 2009
Sold by
Pickering Olga
Bought by
Chase Merritt Fund 1 Llc
Purchase Details
Closed on
Aug 13, 1996
Sold by
Walker Donald E and Walker Janet P
Bought by
Pickering Olga
Home Financials for this Owner
Home Financials are based on the most recent Mortgage that was taken out on this home.
Original Mortgage
$117,750
Interest Rate
8.1%
Mortgage Type
FHA
Purchase Details
Closed on
May 31, 1994
Sold by
Va
Bought by
Walker Donald E and Walker Janet P
Create a Home Valuation Report for This Property
The Home Valuation Report is an in-depth analysis detailing your home's value as well as a comparison with similar homes in the area
Home Values in the Area
Average Home Value in this Area
Purchase History
| Date | Buyer | Sale Price | Title Company |
|---|---|---|---|
| Ace Asset Leasing Llc | $250,000 | First American Title Company | |
| Chase Merritt Fund 1 Llc | -- | None Available | |
| Pickering Olga | $121,000 | Benefit Land Title Company | |
| Walker Donald E | -- | -- |
Source: Public Records
Mortgage History
| Date | Status | Borrower | Loan Amount |
|---|---|---|---|
| Previous Owner | Pickering Olga | $117,750 |
Source: Public Records
Tax History Compared to Growth
Tax History
| Year | Tax Paid | Tax Assessment Tax Assessment Total Assessment is a certain percentage of the fair market value that is determined by local assessors to be the total taxable value of land and additions on the property. | Land | Improvement |
|---|---|---|---|---|
| 2025 | $3,863 | $322,697 | $234,296 | $88,401 |
| 2024 | $3,863 | $316,370 | $229,702 | $86,668 |
| 2023 | $3,780 | $310,167 | $225,198 | $84,969 |
| 2022 | $3,731 | $304,086 | $220,783 | $83,303 |
| 2021 | $3,736 | $298,124 | $216,454 | $81,670 |
| 2020 | $3,720 | $295,068 | $214,235 | $80,833 |
| 2019 | $3,612 | $289,283 | $210,034 | $79,249 |
| 2018 | $3,539 | $283,611 | $205,915 | $77,696 |
| 2017 | $3,403 | $278,050 | $201,877 | $76,173 |
| 2016 | $3,392 | $272,599 | $197,919 | $74,680 |
| 2015 | $3,362 | $268,505 | $194,946 | $73,559 |
| 2014 | $3,159 | $263,246 | $191,127 | $72,119 |
Source: Public Records
Map
Nearby Homes
- 1101 S Clifpark Cir
- 2144 E Almont Ave
- 617 E Eton Place
- 611 E Eton Place
- 1415 E South St
- 1615 E South St
- 725 S Mosaic St
- 760 S Olive St
- 1206 W Cara Dr
- 1539 W Cara Dr
- 1638 S Urbana St
- 1422 S Urbana St
- 1020 S Cambridge St
- 651 E Valencia St
- 1403 W Bushell St
- 842 S Anaheim Blvd
- 1407 W Bushell St
- 1522 S Urbana St
- 1414 S Urbana St
- 1415 W Cara Dr
- 1123 S Clifpark Cir Unit 4
- 1127 S Clifpark Cir Unit 6F
- 1127 S Clifpark Cir
- 1125 S Clifpark Cir
- 1129 S Clifpark Cir Unit 7G
- 1200 E Bell Ave Unit 2B
- 1200 E Bell Ave
- 1131 S Clifpark Cir Unit 8H
- 1133 S Clifpark Cir Unit 9
- 1135 S Clifpark Cir Unit 10C
- 1135 S Clifpark Cir
- 1126 S Clifpark Cir
- 1130 S Clifpark Cir Unit 34
- 1134 S Clifpark Cir Unit 32K
- 1137 S Clifpark Cir Unit 11D
- 1140 S Clifpark Cir
- 1208 E Bell Ave Unit 40B
- 1138 S Clifpark Cir Unit 30S
- 1128 S Clifpark Cir Unit 35N
- 1132 S Clifpark Cir Unit 33L