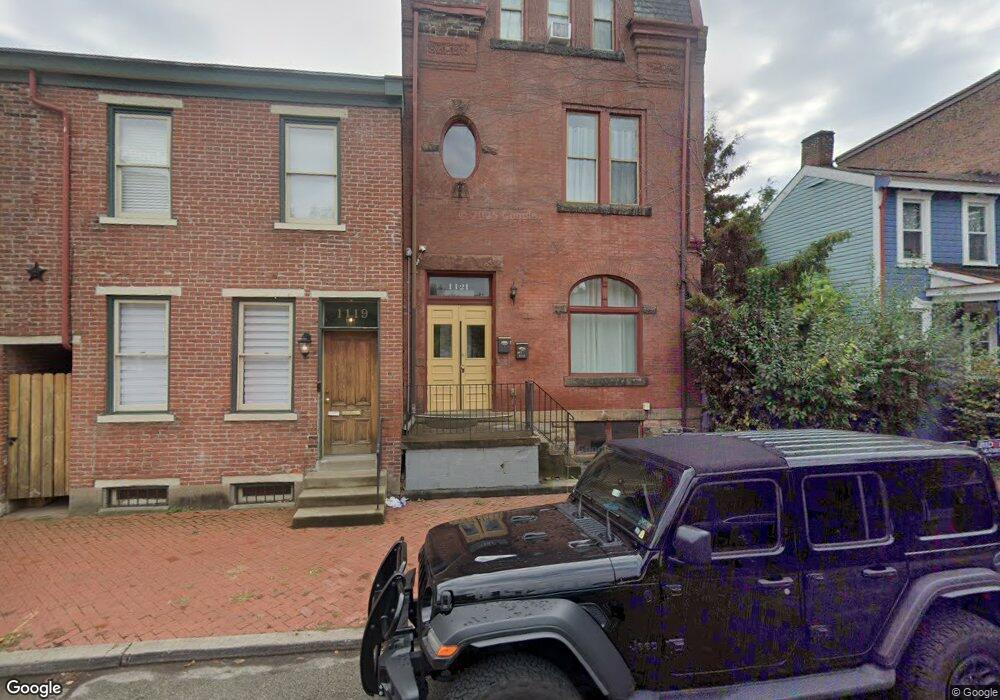
1121 Sheffield St Pittsburgh, PA 15233
Manchester NeighborhoodEstimated Value: $424,000 - $519,000
4
Beds
2
Baths
2,812
Sq Ft
$169/Sq Ft
Est. Value
About This Home
This home is located at 1121 Sheffield St, Pittsburgh, PA 15233 and is currently estimated at $476,431, approximately $169 per square foot. 1121 Sheffield St is a home located in Allegheny County with nearby schools including Pittsburgh Manchester K-8, Pittsburgh Perry High School, and Manchester Academic Charter School.
Ownership History
Date
Name
Owned For
Owner Type
Purchase Details
Closed on
Sep 30, 2022
Sold by
Bhi Manchester Llc
Bought by
North Shore Investments Llc
Current Estimated Value
Purchase Details
Closed on
Feb 10, 2017
Sold by
Bhi Capital Llc A Pennsylvania Llc
Bought by
Bhi Manchester Llc A Pennsylvania Llc
Home Financials for this Owner
Home Financials are based on the most recent Mortgage that was taken out on this home.
Original Mortgage
$168,750
Interest Rate
4.12%
Mortgage Type
Future Advance Clause Open End Mortgage
Purchase Details
Closed on
Oct 27, 2015
Sold by
Real Curb Appeal Llp
Bought by
Bhi Capital Llc
Purchase Details
Closed on
Jan 18, 2006
Sold by
Cullen Emmett
Bought by
Real Curb Appeal L L P
Purchase Details
Closed on
Feb 23, 1984
Bought by
Urban Redevelopment Auth Of Pittsburgh
Create a Home Valuation Report for This Property
The Home Valuation Report is an in-depth analysis detailing your home's value as well as a comparison with similar homes in the area
Home Values in the Area
Average Home Value in this Area
Purchase History
| Date | Buyer | Sale Price | Title Company |
|---|---|---|---|
| North Shore Investments Llc | $375,000 | -- | |
| North Shore Investments Llc | $375,000 | -- | |
| Bhi Manchester Llc A Pennsylvania Llc | $27,500 | Pv Settlement Llc | |
| Bhi Capital Llc | $81,930 | None Available | |
| Real Curb Appeal L L P | $39,900 | -- | |
| Urban Redevelopment Auth Of Pittsburgh | -- | -- |
Source: Public Records
Mortgage History
| Date | Status | Borrower | Loan Amount |
|---|---|---|---|
| Previous Owner | Bhi Manchester Llc A Pennsylvania Llc | $168,750 |
Source: Public Records
Tax History Compared to Growth
Tax History
| Year | Tax Paid | Tax Assessment Tax Assessment Total Assessment is a certain percentage of the fair market value that is determined by local assessors to be the total taxable value of land and additions on the property. | Land | Improvement |
|---|---|---|---|---|
| 2025 | $5,486 | $238,100 | $17,100 | $221,000 |
| 2024 | $5,486 | $238,100 | $17,100 | $221,000 |
| 2023 | $634 | $27,500 | $17,100 | $10,400 |
| 2022 | $625 | $27,500 | $17,100 | $10,400 |
| 2021 | $625 | $27,500 | $17,100 | $10,400 |
| 2020 | $622 | $27,500 | $17,100 | $10,400 |
| 2019 | $622 | $27,500 | $17,100 | $10,400 |
| 2018 | $499 | $27,500 | $17,100 | $10,400 |
| 2017 | $622 | $27,500 | $17,100 | $10,400 |
| 2016 | $130 | $27,500 | $17,100 | $10,400 |
| 2015 | $130 | $27,500 | $17,100 | $10,400 |
| 2014 | $609 | $27,500 | $17,100 | $10,400 |
Source: Public Records
Map
Nearby Homes
- 1215 W North Ave
- 942 W North Ave
- 922 W North Ave
- 1248 Liverpool St
- 1322 W North Ave
- 922 Beech Ave
- 1327 Liverpool St
- 1009 Manhattan St
- 1515 Manhattan St
- 1513 Manhattan St
- 1426 Pennsylvania Ave
- 1704 Fulton St
- 1235 Columbus Ave
- 1720 Fulton St
- 1243 Columbus Ave
- 1231 Columbus Ave
- 1251 Columbus Ave
- 1726 Fulton St
- 1615 Manhattan St
- 1738 Fulton St
- 1119 Sheffield St
- 1117 Sheffield St
- 1115 Sheffield St
- 1113 Sheffield St
- 1125 Sheffield St
- 1111 Sheffield St
- 1127 Sheffield St
- 1127 Sheffield St Unit 2
- 1123 Sheffield St
- 1109 Sheffield St
- 1129 Sheffield St
- 1107 Sheffield St
- 1131 Sheffield St
- 1116 Sheffield St
- 1133 Sheffield St
- 1105 Sheffield St
- 1124 Sheffield St
- 1110 Sheffield St Unit 302
- 1110 Sheffield St
- 1112 Sheffield St