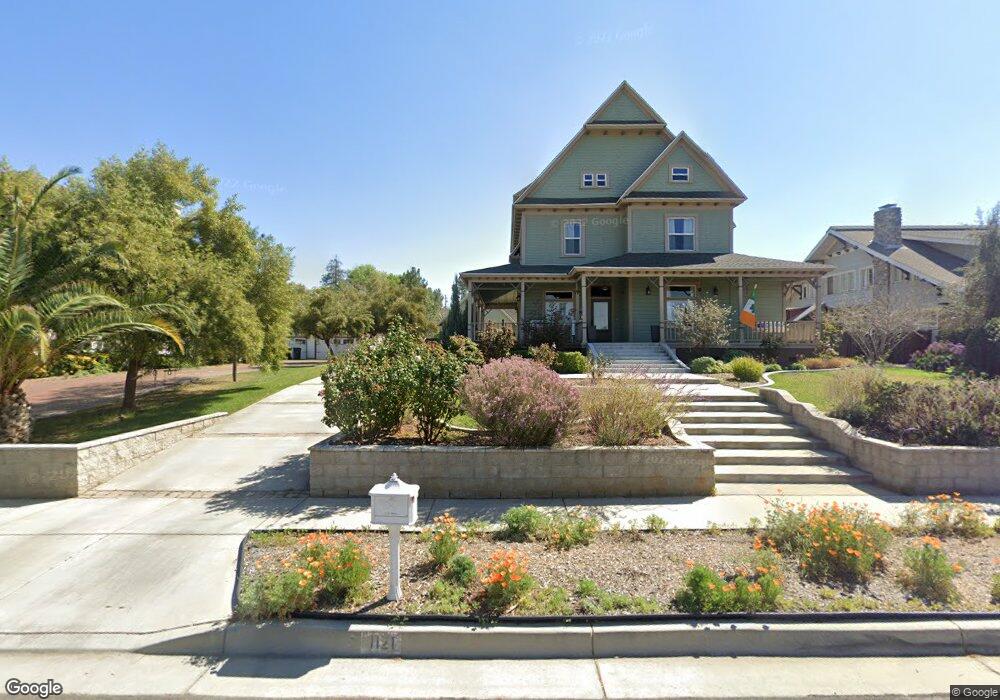
1121 W Clifton Ave Unit 1 Redlands, CA 92373
South Redlands NeighborhoodEstimated Value: $1,279,000 - $1,528,000
4
Beds
3
Baths
3,700
Sq Ft
$369/Sq Ft
Est. Value
About This Home
This home is located at 1121 W Clifton Ave Unit 1, Redlands, CA 92373 and is currently estimated at $1,366,290, approximately $369 per square foot. 1121 W Clifton Ave Unit 1 is a home located in San Bernardino County with nearby schools including Smiley Elementary School, Cope Middle School, and Redlands Senior High School.
Ownership History
Date
Name
Owned For
Owner Type
Purchase Details
Closed on
Oct 3, 2024
Sold by
Evans Alisa and Evans Ryan
Bought by
Evans Family Revocable Trust and Evans
Current Estimated Value
Purchase Details
Closed on
Jun 24, 2021
Sold by
Osborn Lori and Osborn Allen
Bought by
Evans Alisa and Evans Ryan
Home Financials for this Owner
Home Financials are based on the most recent Mortgage that was taken out on this home.
Original Mortgage
$548,250
Interest Rate
2.9%
Mortgage Type
New Conventional
Purchase Details
Closed on
Jul 9, 2010
Sold by
Vines Theron L and Vines Geneil
Bought by
Osborn Lori and Osborn Allen
Home Financials for this Owner
Home Financials are based on the most recent Mortgage that was taken out on this home.
Original Mortgage
$417,000
Interest Rate
4.52%
Mortgage Type
New Conventional
Create a Home Valuation Report for This Property
The Home Valuation Report is an in-depth analysis detailing your home's value as well as a comparison with similar homes in the area
Home Values in the Area
Average Home Value in this Area
Purchase History
| Date | Buyer | Sale Price | Title Company |
|---|---|---|---|
| Evans Family Revocable Trust | -- | None Listed On Document | |
| Evans Alisa | $960,000 | First American Title | |
| Osborn Lori | $539,000 | Ticor Title Company |
Source: Public Records
Mortgage History
| Date | Status | Borrower | Loan Amount |
|---|---|---|---|
| Previous Owner | Evans Alisa | $548,250 | |
| Previous Owner | Osborn Lori | $417,000 |
Source: Public Records
Tax History Compared to Growth
Tax History
| Year | Tax Paid | Tax Assessment Tax Assessment Total Assessment is a certain percentage of the fair market value that is determined by local assessors to be the total taxable value of land and additions on the property. | Land | Improvement |
|---|---|---|---|---|
| 2025 | $14,651 | $1,273,658 | $305,628 | $968,030 |
| 2024 | $14,651 | $1,248,684 | $299,635 | $949,049 |
| 2023 | $14,477 | $1,204,200 | $293,760 | $910,440 |
| 2022 | $11,593 | $960,000 | $288,000 | $672,000 |
| 2021 | $7,930 | $637,968 | $191,390 | $446,578 |
| 2020 | $7,811 | $631,427 | $189,428 | $441,999 |
| 2019 | $7,590 | $619,046 | $185,714 | $433,332 |
| 2018 | $7,398 | $606,908 | $182,073 | $424,835 |
| 2017 | $7,334 | $595,008 | $178,503 | $416,505 |
| 2016 | $7,249 | $583,341 | $175,003 | $408,338 |
| 2015 | $7,194 | $574,578 | $172,374 | $402,204 |
| 2014 | $7,062 | $563,322 | $168,997 | $394,325 |
Source: Public Records
Map
Nearby Homes
- 636 Harding Dr
- 1110 W Cypress Ave
- 1044 W Cypress Ave
- 805 Nottingham Dr
- 527 Nottingham Dr
- 526 Nottingham Dr
- 521 Bond St
- 805 S Center St
- 622 Esther Way
- 527 W Palm Ave
- 0 Sunnyside Ave Unit IG25092932
- 1239 Fulbright Ave
- 628 Sunnyside Ave
- 1324 W Fern Ave
- 325 Lakeside Ave
- 628 W Fern Ave
- 1327 Monterey St
- 1228 S Center St
- 1471 Rosehill Crescent
- 1417 Bella Vista Crescent
- 1121 W Clifton Ave
- 1127 W Clifton Ave
- 1115 W Clifton Ave
- 1113 W Clifton Ave
- 1135 W Clifton Ave
- 630 Casa de Leon
- 710 Harding Dr
- 1130 W Clifton Ave
- 1095 W Clifton Ave
- 1128 W Palm Ave
- 1122 W Palm Ave
- 1108 W Palm Ave
- 725 S San Mateo St
- 626 Casa de Leon
- 629 Casa de Leon
- 731 S San Mateo St
- 641 S San Mateo St
- 1114 W Palm Ave
- 622 Casa de Leon
- 625 Casa de Leon