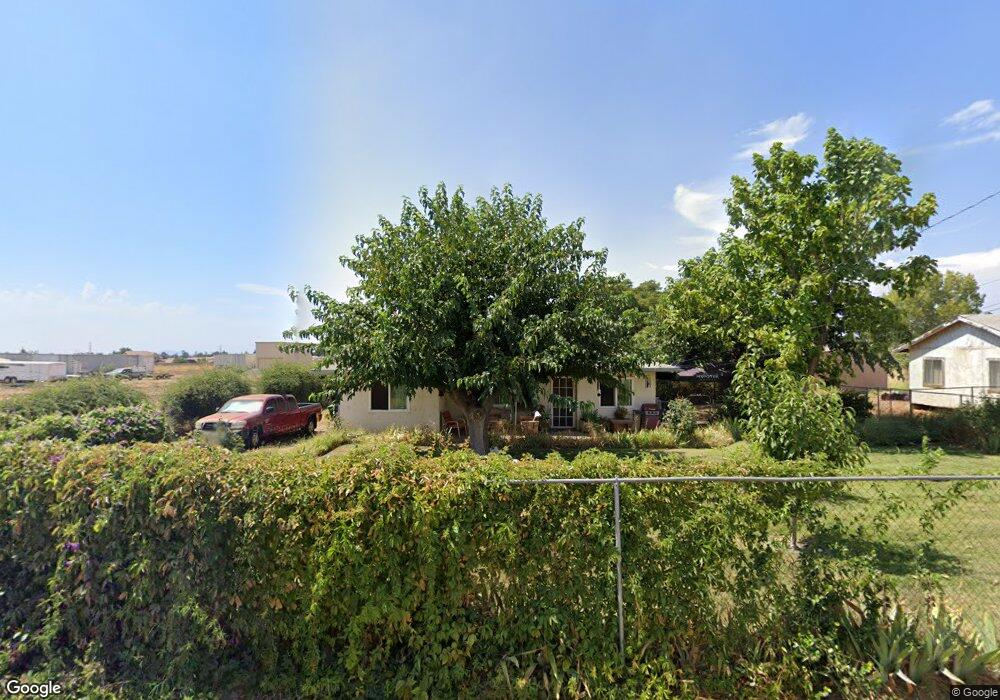
11211 Sunnyslope Ave Cherry Valley, CA 92223
Estimated Value: $405,000 - $527,000
3
Beds
2
Baths
1,122
Sq Ft
$401/Sq Ft
Est. Value
About This Home
This home is located at 11211 Sunnyslope Ave, Cherry Valley, CA 92223 and is currently estimated at $450,328, approximately $401 per square foot. 11211 Sunnyslope Ave is a home located in Riverside County with nearby schools including Starlight Elementary School, San Gorgonio Middle School, and Beaumont Senior High School.
Ownership History
Date
Name
Owned For
Owner Type
Purchase Details
Closed on
Jun 27, 2005
Sold by
Mcpherson Vivianne
Bought by
Mcpherson Vivianne
Current Estimated Value
Home Financials for this Owner
Home Financials are based on the most recent Mortgage that was taken out on this home.
Original Mortgage
$156,000
Outstanding Balance
$80,379
Interest Rate
5.46%
Mortgage Type
Stand Alone Refi Refinance Of Original Loan
Estimated Equity
$369,949
Purchase Details
Closed on
Jul 6, 2004
Sold by
Mcpherson Vivianne
Bought by
Mcpherson Vivianne
Purchase Details
Closed on
Dec 30, 1997
Sold by
Rudolph Finley Arnold and Rudolph Arfedalia
Bought by
Mcpherson Vivianne
Home Financials for this Owner
Home Financials are based on the most recent Mortgage that was taken out on this home.
Original Mortgage
$87,883
Interest Rate
7.14%
Mortgage Type
FHA
Create a Home Valuation Report for This Property
The Home Valuation Report is an in-depth analysis detailing your home's value as well as a comparison with similar homes in the area
Home Values in the Area
Average Home Value in this Area
Purchase History
| Date | Buyer | Sale Price | Title Company |
|---|---|---|---|
| Mcpherson Vivianne | -- | Alliance Title Riverside | |
| Mcpherson Vivianne | -- | -- | |
| Mcpherson Vivianne | $88,000 | Gateway Title Company |
Source: Public Records
Mortgage History
| Date | Status | Borrower | Loan Amount |
|---|---|---|---|
| Open | Mcpherson Vivianne | $156,000 | |
| Closed | Mcpherson Vivianne | $87,883 |
Source: Public Records
Tax History Compared to Growth
Tax History
| Year | Tax Paid | Tax Assessment Tax Assessment Total Assessment is a certain percentage of the fair market value that is determined by local assessors to be the total taxable value of land and additions on the property. | Land | Improvement |
|---|---|---|---|---|
| 2025 | $1,760 | $140,478 | $79,818 | $60,660 |
| 2023 | $1,760 | $135,024 | $76,719 | $58,305 |
| 2022 | $1,730 | $132,377 | $75,215 | $57,162 |
| 2021 | $1,696 | $129,783 | $73,741 | $56,042 |
| 2020 | $1,676 | $128,453 | $72,985 | $55,468 |
| 2019 | $1,649 | $125,935 | $71,554 | $54,381 |
| 2018 | $1,640 | $123,466 | $70,151 | $53,315 |
| 2017 | $1,611 | $121,046 | $68,776 | $52,270 |
| 2016 | $1,567 | $118,674 | $67,428 | $51,246 |
| 2015 | $1,540 | $116,893 | $66,416 | $50,477 |
| 2014 | $1,539 | $114,605 | $65,116 | $49,489 |
Source: Public Records
Map
Nearby Homes
- 11345 Sunnyslope Ave
- 11285 Cherry Ave
- 1679 Stone Creek Rd
- 1123 Brown Bear Trail
- 1627 Quail Summit Dr
- 645 Bryce Ln
- 1322 Melstone St
- 1657 Stone Creek Rd
- 10956 Cherry Ave
- 1661 Milford Way
- 717 Lions Lair Rd
- 1664 Milford Way
- 11615 Zoeller St
- 601 Cypress St
- 1626 Stone Creek Rd
- 1628 Tildon Ct
- 1601 Stone Creek Rd
- 1569 Milky Way
- 1574 Asteroid Way
- 1475 Ellerg Way
- 11203 Sunnyslope Ave
- 11168 Sunnyslope Ave
- 11243 Sunnyslope Ave
- 11212 Sunnyslope Ave
- 11227 Sunnyslope Ave
- 11248 Sunnyslope Ave
- 11142 Sunnyslope Ave
- 11138 Sunnyslope Ave
- 11231 Cherry Ave
- 11134 Sunnyslope Ave
- 11250 Sunnyslope Ave
- 11217 Cherry Ave
- 11105 Sunnyslope Ave
- 11130 Sunnyslope Ave
- 11280 Sunnyslope Ave
- 11211 Cherry Ave
- 11083 Sunnyslope Ave
- 11269 Cherry Ave
- 11167 Cherry Ave
- 11233 Cherry Ave