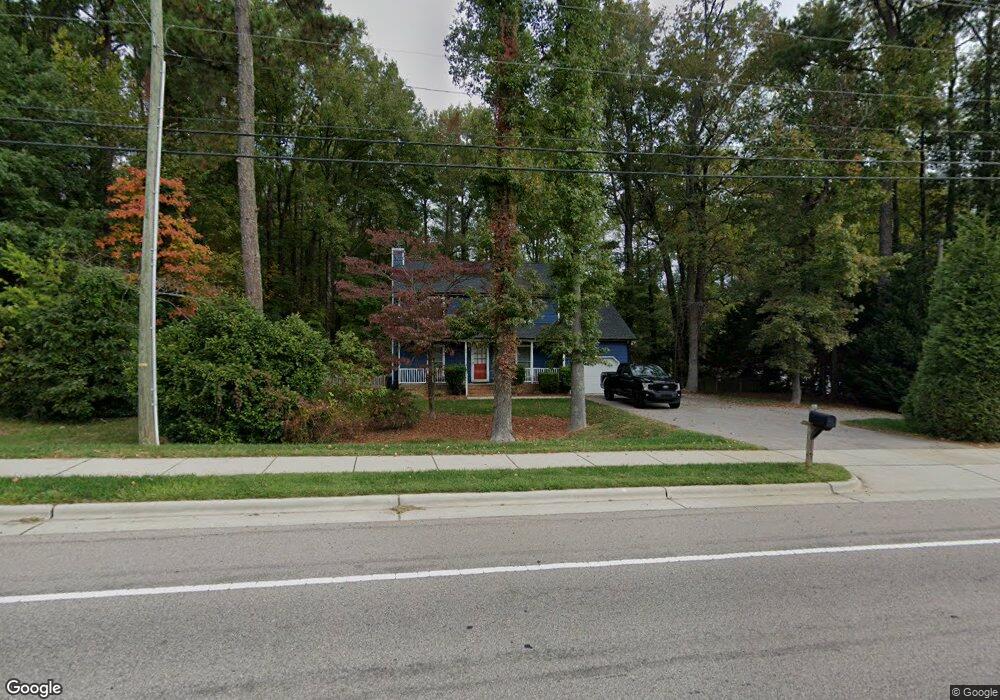
11212 Leesville Rd Raleigh, NC 27613
Estimated Value: $428,003 - $530,000
--
Bed
2
Baths
1,705
Sq Ft
$273/Sq Ft
Est. Value
About This Home
This home is located at 11212 Leesville Rd, Raleigh, NC 27613 and is currently estimated at $465,251, approximately $272 per square foot. 11212 Leesville Rd is a home located in Wake County with nearby schools including Sycamore Creek Elementary School, Pine Hollow Middle School, and Leesville Road High School.
Ownership History
Date
Name
Owned For
Owner Type
Purchase Details
Closed on
Dec 18, 2013
Sold by
Roof James J and Roof Anne
Bought by
Roof Brian D
Current Estimated Value
Home Financials for this Owner
Home Financials are based on the most recent Mortgage that was taken out on this home.
Original Mortgage
$179,448
Outstanding Balance
$134,019
Interest Rate
4.19%
Mortgage Type
New Conventional
Estimated Equity
$331,232
Purchase Details
Closed on
Jan 11, 2006
Sold by
Singleton Benjamin Todd and Singleton Kelly I
Bought by
Roof James J and Brunnemeyer Anne A
Home Financials for this Owner
Home Financials are based on the most recent Mortgage that was taken out on this home.
Original Mortgage
$33,400
Interest Rate
6.18%
Mortgage Type
Fannie Mae Freddie Mac
Create a Home Valuation Report for This Property
The Home Valuation Report is an in-depth analysis detailing your home's value as well as a comparison with similar homes in the area
Home Values in the Area
Average Home Value in this Area
Purchase History
| Date | Buyer | Sale Price | Title Company |
|---|---|---|---|
| Roof Brian D | $185,000 | None Available | |
| Roof James J | $167,000 | None Available |
Source: Public Records
Mortgage History
| Date | Status | Borrower | Loan Amount |
|---|---|---|---|
| Open | Roof Brian D | $179,448 | |
| Previous Owner | Roof James J | $33,400 | |
| Previous Owner | Roof James J | $133,600 |
Source: Public Records
Tax History Compared to Growth
Tax History
| Year | Tax Paid | Tax Assessment Tax Assessment Total Assessment is a certain percentage of the fair market value that is determined by local assessors to be the total taxable value of land and additions on the property. | Land | Improvement |
|---|---|---|---|---|
| 2025 | $2,600 | $403,415 | $160,000 | $243,415 |
| 2024 | $2,525 | $403,415 | $160,000 | $243,415 |
| 2023 | $1,984 | $251,945 | $90,000 | $161,945 |
| 2022 | $1,840 | $251,945 | $90,000 | $161,945 |
| 2021 | $1,790 | $251,945 | $90,000 | $161,945 |
| 2020 | $1,761 | $251,945 | $90,000 | $161,945 |
| 2019 | $1,601 | $193,642 | $70,000 | $123,642 |
| 2018 | $1,473 | $193,642 | $70,000 | $123,642 |
| 2017 | $1,397 | $193,642 | $70,000 | $123,642 |
| 2016 | $1,369 | $193,642 | $70,000 | $123,642 |
| 2015 | $1,371 | $194,566 | $70,000 | $124,566 |
| 2014 | $1,300 | $194,566 | $70,000 | $124,566 |
Source: Public Records
Map
Nearby Homes
- 5906 Dunzo Dr
- 5960 Dunzo Dr
- 5952 Dunzo Dr
- 5956 Dunzo Dr
- 5900 Dunzo Dr
- 5904 Dunzo Dr
- 5902 Dunzo Dr
- 6040 Dunzo Dr
- 6108 Dunzo Dr
- 5950 Dunzo Dr
- 11209 Sedgefield Dr
- 5954 Dunzo Dr
- Harlow Plan at Bayberry
- 10917 Bayflower Way
- 10916 Bayflower Way
- 10906 Bayflower Way
- 10907 Bayflower Way
- 10900 Bayflower Way
- 10901 Bayflower Way
- 7846 Cape Charles Dr
- 11208 Leesville Rd
- 11201 Sedgefield Dr
- 11205 Sedgefield Dr
- 11220 Leesville Rd
- 11108 Crestmont Dr
- 10916 Bayflower Way Dr
- 11016 Leesville Rd
- 11112 Crestmont Dr
- 9736 Renfield Dr
- 9734 Renfield Dr
- 9732 Renfield Dr
- 11116 Crestmont Dr
- 11104 Crestmont Dr
- 5905 Helena Ct
- 11204 Sedgefield Dr
- 9730 Renfield Dr
- 6231 Oconner
- 11105 Crestmont Dr
- 11300 Leesville Rd
- 9724 Renfield Dr