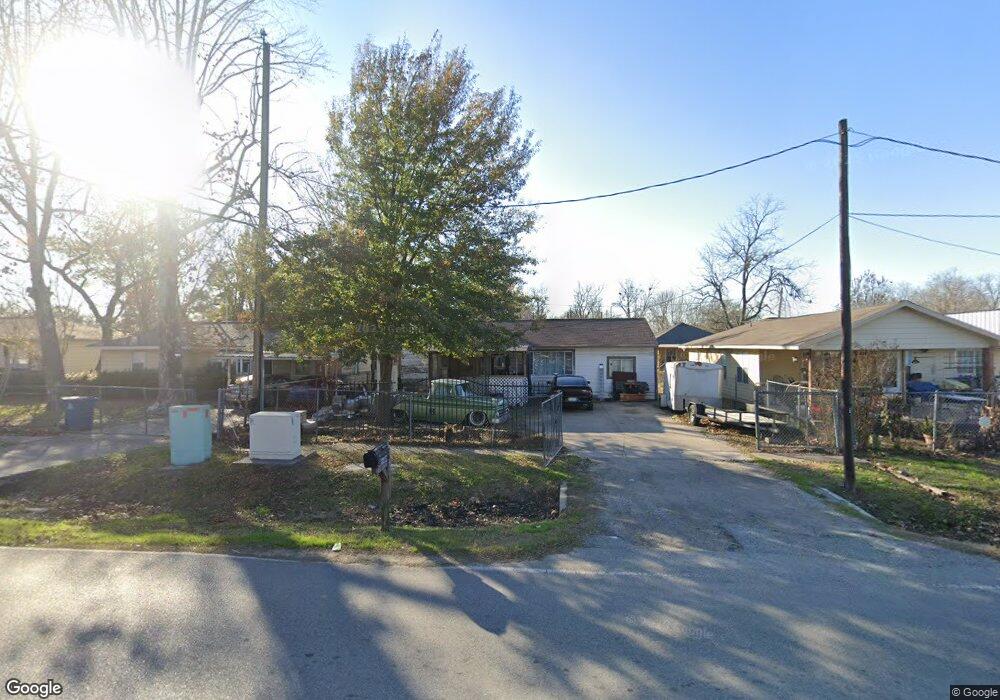
11215 Bentley St Houston, TX 77093
East Aldine NeighborhoodEstimated Value: $101,000 - $147,000
2
Beds
1
Bath
774
Sq Ft
$160/Sq Ft
Est. Value
About This Home
This home is located at 11215 Bentley St, Houston, TX 77093 and is currently estimated at $124,074, approximately $160 per square foot. 11215 Bentley St is a home located in Harris County with nearby schools including Scarborough Elementary School, Patrick Henry Middle School, and Sam Houston Math, Science & Technology Center.
Ownership History
Date
Name
Owned For
Owner Type
Purchase Details
Closed on
Aug 14, 2013
Sold by
Ramirez Ervin and Ramirez Sharon Ray
Bought by
Espinoza Luis A and Espinoza Delia D
Current Estimated Value
Home Financials for this Owner
Home Financials are based on the most recent Mortgage that was taken out on this home.
Original Mortgage
$35,000
Interest Rate
4.53%
Mortgage Type
Purchase Money Mortgage
Purchase Details
Closed on
Apr 11, 2012
Sold by
Sauer Herbert Allen
Bought by
Ramirez Ervin and Ramirez Sharon Kay
Purchase Details
Closed on
Feb 6, 2007
Sold by
Sauer Herbert A and Ellidge George
Bought by
Ramirez Ervin and Ramirez Sharon Kay
Home Financials for this Owner
Home Financials are based on the most recent Mortgage that was taken out on this home.
Original Mortgage
$25,000
Interest Rate
6.21%
Mortgage Type
Seller Take Back
Purchase Details
Closed on
Apr 22, 2003
Sold by
Estate Of Gayl Mckean Patton Sauer
Bought by
Sauer Herbert Allen
Create a Home Valuation Report for This Property
The Home Valuation Report is an in-depth analysis detailing your home's value as well as a comparison with similar homes in the area
Home Values in the Area
Average Home Value in this Area
Purchase History
| Date | Buyer | Sale Price | Title Company |
|---|---|---|---|
| Espinoza Luis A | -- | None Available | |
| Ramirez Ervin | -- | None Available | |
| Ramirez Ervin | $5,000 | None Available | |
| Sauer Herbert Allen | -- | -- |
Source: Public Records
Mortgage History
| Date | Status | Borrower | Loan Amount |
|---|---|---|---|
| Closed | Espinoza Luis A | $35,000 | |
| Previous Owner | Ramirez Ervin | $25,000 |
Source: Public Records
Tax History Compared to Growth
Tax History
| Year | Tax Paid | Tax Assessment Tax Assessment Total Assessment is a certain percentage of the fair market value that is determined by local assessors to be the total taxable value of land and additions on the property. | Land | Improvement |
|---|---|---|---|---|
| 2025 | $1,648 | $93,752 | $42,162 | $51,590 |
| 2024 | $1,648 | $93,752 | $42,162 | $51,590 |
| 2023 | $1,648 | $99,879 | $42,162 | $57,717 |
| 2022 | $1,466 | $78,828 | $32,263 | $46,565 |
| 2021 | $1,350 | $68,379 | $32,263 | $36,116 |
| 2020 | $1,276 | $62,125 | $32,263 | $29,862 |
| 2019 | $1,331 | $62,125 | $32,263 | $29,862 |
| 2018 | $1,018 | $47,538 | $32,263 | $15,275 |
| 2017 | $1,018 | $47,538 | $32,263 | $15,275 |
| 2016 | $1,018 | $47,538 | $32,263 | $15,275 |
| 2015 | $825 | $38,567 | $20,164 | $18,403 |
| 2014 | $825 | $38,567 | $20,164 | $18,403 |
Source: Public Records
Map
Nearby Homes
- 3418 Hopper Rd
- 3214 Brea Crest St
- 2817 Cromwell St
- 2915 Brea Crest St
- 3804 Cedar Hill Ln
- 3111 Hartwick Rd
- 2629 Kowis St
- 1904 Little York Rd
- 4415 Mooney Rd
- 4007 Wedgewood St
- 1728 Little York Rd
- 2636 Lone Oak Rd
- 2723 Castledale Dr
- 11716 Innsbury Dr
- 4410 Shelton Rd
- 11206 Eastex Fwy
- 2311 Warwick Rd
- 2237 Cromwell St
- 11746 Somerset Ln
- 2326 Sunny Dr
- 11217 Bentley St
- 11209 Bentley St
- 3310 Hopper Rd
- 11205 Bentley St
- 3309 Mohawk St
- 3306 Hopper Rd
- 11201 Bentley St
- 3305 Mohawk St
- 11214 Bentley St
- 11210 Bentley St
- 3301 Mohawk St
- 3302 Hopper Rd
- 11206 Bentley St
- 11229 Bentley St
- 3225 Mohawk St
- 11202 Bentley St
- 3226 Hopper Rd
- 11133 Bentley St
- 11226 Bentley St
- 3410 Hopper Rd