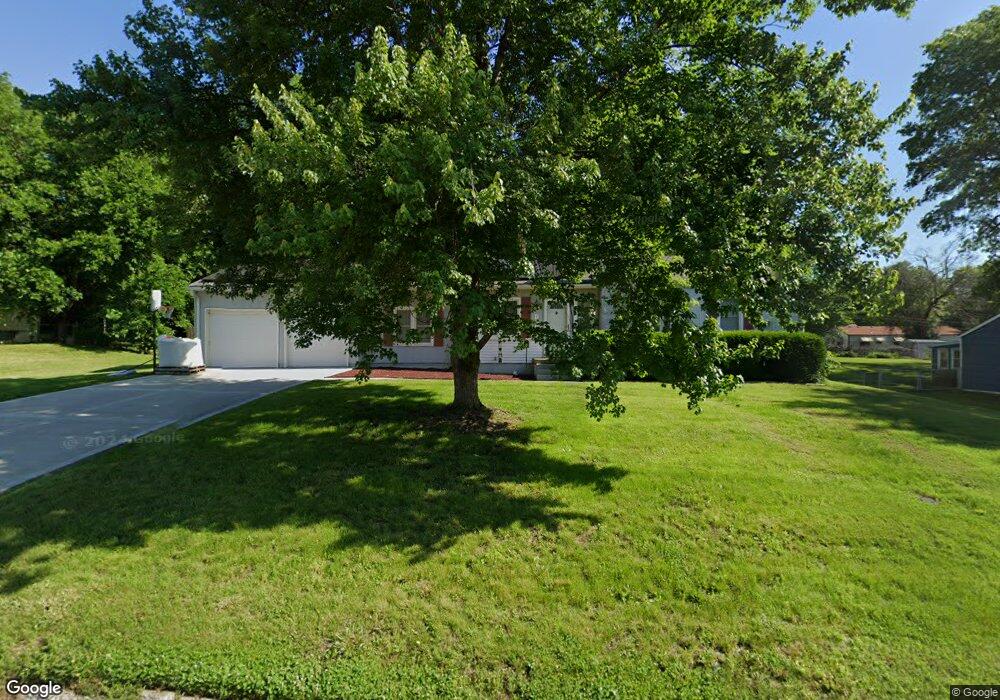
11216 E 47th Terrace Kansas City, MO 64133
Sterling NeighborhoodEstimated Value: $249,527 - $277,000
3
Beds
2
Baths
1,236
Sq Ft
$215/Sq Ft
Est. Value
About This Home
This home is located at 11216 E 47th Terrace, Kansas City, MO 64133 and is currently estimated at $265,132, approximately $214 per square foot. 11216 E 47th Terrace is a home located in Jackson County with nearby schools including Fleetridge Elementary School, Raytown Middle School, and Raytown South High School.
Ownership History
Date
Name
Owned For
Owner Type
Purchase Details
Closed on
Mar 21, 2022
Sold by
Martinez Raquel M and Martinez Nicholas
Bought by
Martinez Roma V
Current Estimated Value
Home Financials for this Owner
Home Financials are based on the most recent Mortgage that was taken out on this home.
Original Mortgage
$204,250
Outstanding Balance
$191,344
Interest Rate
4.16%
Mortgage Type
New Conventional
Estimated Equity
$73,788
Purchase Details
Closed on
Apr 1, 2011
Sold by
Devor Craig W and Devor Joy L
Bought by
Martinez Raquel M
Home Financials for this Owner
Home Financials are based on the most recent Mortgage that was taken out on this home.
Original Mortgage
$105,749
Interest Rate
4.98%
Mortgage Type
FHA
Purchase Details
Closed on
May 22, 2000
Sold by
Swinney Nilene R and Swinney Nilene R
Bought by
Devor Craig W and Devor Joy L
Home Financials for this Owner
Home Financials are based on the most recent Mortgage that was taken out on this home.
Original Mortgage
$103,075
Interest Rate
8.17%
Mortgage Type
Purchase Money Mortgage
Create a Home Valuation Report for This Property
The Home Valuation Report is an in-depth analysis detailing your home's value as well as a comparison with similar homes in the area
Home Values in the Area
Average Home Value in this Area
Purchase History
| Date | Buyer | Sale Price | Title Company |
|---|---|---|---|
| Martinez Roma V | -- | Meridian Title | |
| Martinez Roma V | $271,652 | Meridian Title | |
| Martinez Raquel M | -- | Kansas City Title Inc | |
| Devor Craig W | -- | Heart Of America Title Inc |
Source: Public Records
Mortgage History
| Date | Status | Borrower | Loan Amount |
|---|---|---|---|
| Open | Martinez Roma V | $204,250 | |
| Closed | Martinez Roma V | $204,250 | |
| Previous Owner | Martinez Raquel M | $105,749 | |
| Previous Owner | Devor Craig W | $103,075 |
Source: Public Records
Tax History Compared to Growth
Tax History
| Year | Tax Paid | Tax Assessment Tax Assessment Total Assessment is a certain percentage of the fair market value that is determined by local assessors to be the total taxable value of land and additions on the property. | Land | Improvement |
|---|---|---|---|---|
| 2025 | $4,122 | $28,895 | $3,895 | $25,000 |
| 2024 | $4,122 | $45,545 | $3,678 | $41,867 |
| 2023 | $4,096 | $45,545 | $4,750 | $40,795 |
| 2022 | $2,044 | $21,850 | $5,262 | $16,588 |
| 2021 | $2,044 | $21,850 | $5,262 | $16,588 |
| 2020 | $1,973 | $20,844 | $5,262 | $15,582 |
| 2019 | $1,936 | $20,844 | $5,262 | $15,582 |
| 2018 | $1,678 | $18,140 | $4,579 | $13,561 |
| 2017 | $1,618 | $18,140 | $4,579 | $13,561 |
| 2016 | $1,618 | $17,613 | $3,131 | $14,482 |
| 2014 | $1,576 | $17,100 | $3,040 | $14,060 |
Source: Public Records
Map
Nearby Homes
- 11219 E 47th Terrace
- 11312 E 48th Terrace
- 4541 Appleton Ave
- 4537 Appleton Ave
- 11208 E 45th St
- 4718 Appleton Ave
- 11309 E 49th St
- 11406 E 49th St
- 11717 E 45th Terrace
- 4900 Norwood Ave
- 4500 Harvard Ln
- 10721 E 46th Terrace
- 4605 Appleton Ave
- 10720 E 46th Terrace
- 10717 E 46th Terrace
- 10719 E 46th Terrace
- 4534 Appleton Ave
- 4615 Appleton Ave
- 4607 Appleton Ave
- 4619 Appleton Ave
- 11220 E 47th Terrace
- 11212 E 47th Terrace
- 11219 E 47th St
- 11215 E 47th St
- 11221 E 47th St
- 11224 E 47th Terrace
- 11208 E 47th Terrace
- 11215 E 47th Terrace
- 11223 E 47th Terrace
- 11211 E 47th Terrace
- 11225 E 47th St
- 11207 E 47th St
- 11227 E 47th Terrace
- 11204 E 47th Terrace
- 11207 E 47th Terrace
- 11205 E 47th St
- 11214 E 48th St
- 11218 E 48th St
- 4711 Claremont Ave
- 4707 Claremont Ave