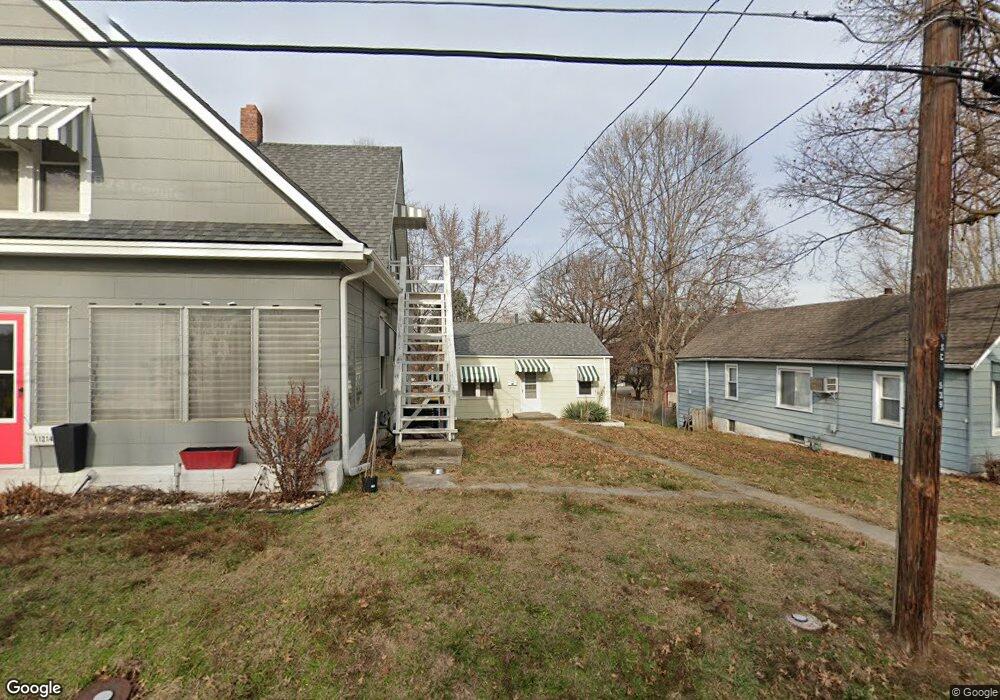
11216 E Norledge St Sugar Creek, MO 64054
Estimated Value: $187,000 - $220,000
4
Beds
2
Baths
2,166
Sq Ft
$94/Sq Ft
Est. Value
About This Home
This home is located at 11216 E Norledge St, Sugar Creek, MO 64054 and is currently estimated at $202,593, approximately $93 per square foot. 11216 E Norledge St is a home located in Jackson County with nearby schools including Sugar Creek Elementary School, Abraham Mallinson Elementary, and Clifford H. Nowlin Middle School.
Ownership History
Date
Name
Owned For
Owner Type
Purchase Details
Closed on
Jul 25, 2024
Sold by
Kenney Joseph D and Kenney Mikayla
Bought by
Richard T Rudkin Jr And Anne M Rudkin Trust and Rudkin
Current Estimated Value
Purchase Details
Closed on
Jan 7, 2019
Sold by
Visnich Claudia A and Spradlin Stephen Randall
Bought by
Kenney Joseph D
Home Financials for this Owner
Home Financials are based on the most recent Mortgage that was taken out on this home.
Original Mortgage
$57,000
Interest Rate
4.8%
Mortgage Type
New Conventional
Purchase Details
Closed on
Feb 8, 2012
Sold by
Visnich Steve
Bought by
Visnich Claudia A and Spradlin Stephen Randall
Purchase Details
Closed on
Jul 30, 2004
Sold by
Onka Bessie and Visnich Steve
Bought by
Visnich Steve and Visnich Maxine I
Create a Home Valuation Report for This Property
The Home Valuation Report is an in-depth analysis detailing your home's value as well as a comparison with similar homes in the area
Home Values in the Area
Average Home Value in this Area
Purchase History
| Date | Buyer | Sale Price | Title Company |
|---|---|---|---|
| Richard T Rudkin Jr And Anne M Rudkin Trust | -- | Platinum Title | |
| Kenney Joseph D | -- | Continental Title | |
| Visnich Claudia A | -- | None Available | |
| Visnich Steve | -- | None Available | |
| Visnich Steve | -- | -- |
Source: Public Records
Mortgage History
| Date | Status | Borrower | Loan Amount |
|---|---|---|---|
| Previous Owner | Kenney Joseph D | $57,000 |
Source: Public Records
Tax History
| Year | Tax Paid | Tax Assessment Tax Assessment Total Assessment is a certain percentage of the fair market value that is determined by local assessors to be the total taxable value of land and additions on the property. | Land | Improvement |
|---|---|---|---|---|
| 2025 | $2,443 | $19,097 | $4,283 | $14,814 |
| 2024 | $2,370 | $32,832 | $3,017 | $29,815 |
| 2023 | $2,370 | $32,832 | $2,449 | $30,383 |
| 2022 | $1,152 | $14,440 | $3,430 | $11,010 |
| 2021 | $1,147 | $14,440 | $3,430 | $11,010 |
| 2020 | $1,115 | $13,735 | $3,430 | $10,305 |
| 2019 | $1,103 | $13,735 | $3,430 | $10,305 |
| 2018 | $858 | $10,410 | $1,448 | $8,962 |
| 2016 | $769 | $9,053 | $1,957 | $7,096 |
Source: Public Records
Map
Nearby Homes
- 11230 Felton St
- 11225 Felton St
- 11229 Evans St
- 107 S Claremont Ave
- 10804 Felton St
- 11524 Hackett St
- 11534 Gill St
- 212 S High St
- 11610 Hackett St
- 11518 E Lexington Ave
- 144 N Hardy Ave
- 11314 E Thompson St
- 11527 E Lexington Ave
- 11814 E Scarritt Ave
- 11813 & 11815 E Scarritt Ave
- 10300 E Norledge Ave
- 128 S Hardy Ave
- 10406 E Lexington Ave
- 405 S Vassar Ave
- 11225 E US Highway 24
- 11218 E Norledge St
- 11212 E Norledge St
- 11220 E Norledge St
- 11215 Gill St
- 11215 E Norledge St
- 11226 E Norledge St
- 11211 Gill St
- 11223 E Norledge St
- 11223 Gill St
- 509 N Sterling Ave
- 11227 E Norledge St
- 11228 E Norledge St
- 11230 E Norledge St
- 503 N Sterling Ave
- 409 N Sterling Ave
- 409 N Sterling Ave Unit 2C
- 409 N Sterling Ave
- 409 N Sterling Ave Unit 2B
- 11214 Gill St
- 11231 E Norledge St
Your Personal Tour Guide
Ask me questions while you tour the home.