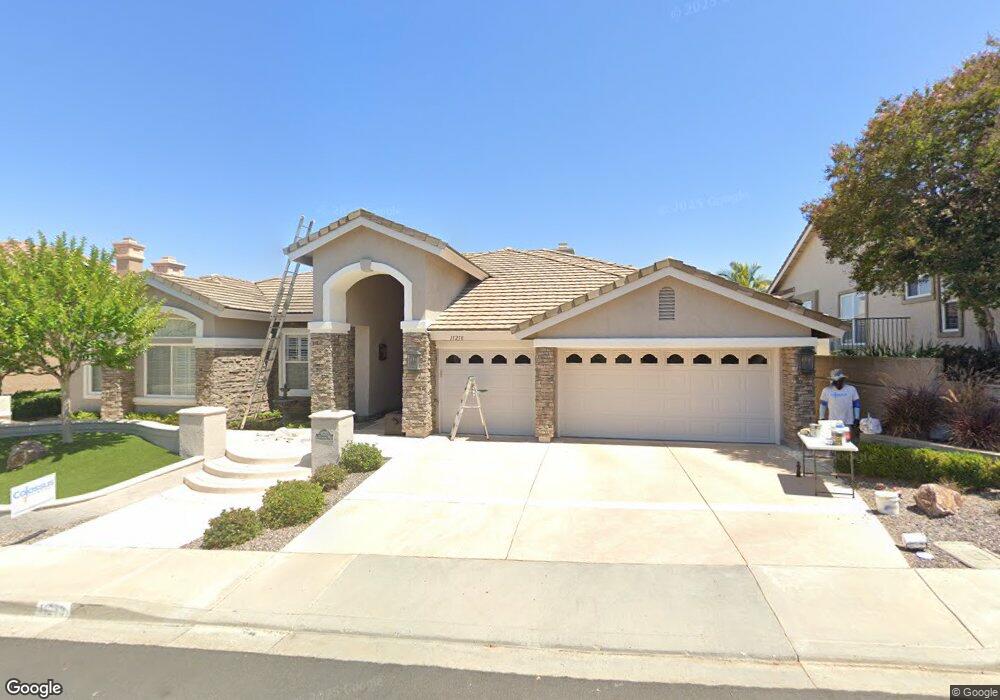
11218 Gatemoore Way San Diego, CA 92131
Miramar Ranch North NeighborhoodEstimated Value: $1,878,283 - $2,150,000
4
Beds
3
Baths
2,974
Sq Ft
$673/Sq Ft
Est. Value
About This Home
This home is located at 11218 Gatemoore Way, San Diego, CA 92131 and is currently estimated at $2,000,071, approximately $672 per square foot. 11218 Gatemoore Way is a home located in San Diego County with nearby schools including Dingeman Elementary School, Thurgood Marshall Middle School, and Scripps Ranch High School.
Ownership History
Date
Name
Owned For
Owner Type
Purchase Details
Closed on
Nov 11, 2010
Sold by
Bowen Patrick and Bowen Ann
Bought by
Bowen Patrick D and Bowen Ann E
Current Estimated Value
Purchase Details
Closed on
Apr 23, 2007
Sold by
Marnella Donald James and Marnella Lois Adele
Bought by
Bowen Patrick and Bowen Ann
Home Financials for this Owner
Home Financials are based on the most recent Mortgage that was taken out on this home.
Original Mortgage
$100,000
Interest Rate
6.15%
Mortgage Type
Purchase Money Mortgage
Purchase Details
Closed on
Jun 26, 1996
Sold by
L & W Investment Inc
Bought by
Marnella Donald James and Marnella Lois Adele
Purchase Details
Closed on
Jun 11, 1996
Sold by
Miramar Ranch North
Bought by
L & W Investments Inc and Continental Homes
Purchase Details
Closed on
Aug 17, 1994
Sold by
Mcmillin Scripps Inc
Bought by
Scripps Lakepoint 1340 L P
Create a Home Valuation Report for This Property
The Home Valuation Report is an in-depth analysis detailing your home's value as well as a comparison with similar homes in the area
Home Values in the Area
Average Home Value in this Area
Purchase History
| Date | Buyer | Sale Price | Title Company |
|---|---|---|---|
| Bowen Patrick D | -- | None Available | |
| Bowen Patrick | $950,000 | California Title Company | |
| Marnella Donald James | $400,000 | First American Title | |
| L & W Investments Inc | -- | First American Title | |
| Miramar Ranch North | -- | First American Title | |
| Scripps Lakepoint 1340 L P | -- | -- | |
| Mcmillin Scripps Inc | -- | -- |
Source: Public Records
Mortgage History
| Date | Status | Borrower | Loan Amount |
|---|---|---|---|
| Closed | Bowen Patrick | $100,000 |
Source: Public Records
Tax History Compared to Growth
Tax History
| Year | Tax Paid | Tax Assessment Tax Assessment Total Assessment is a certain percentage of the fair market value that is determined by local assessors to be the total taxable value of land and additions on the property. | Land | Improvement |
|---|---|---|---|---|
| 2025 | $5,633 | $440,236 | $121,852 | $318,384 |
| 2024 | $5,633 | $431,605 | $119,463 | $312,142 |
| 2023 | $5,497 | $423,143 | $117,121 | $306,022 |
| 2022 | $5,286 | $414,847 | $114,825 | $300,022 |
| 2021 | $5,236 | $406,714 | $112,574 | $294,140 |
| 2020 | $5,176 | $402,544 | $111,420 | $291,124 |
| 2019 | $5,570 | $394,652 | $109,236 | $285,416 |
| 2018 | $6,349 | $386,915 | $107,095 | $279,820 |
| 2017 | $6,259 | $379,330 | $104,996 | $274,334 |
| 2016 | $6,190 | $371,893 | $102,938 | $268,955 |
| 2015 | $6,125 | $366,308 | $101,392 | $264,916 |
| 2014 | $6,044 | $359,133 | $99,406 | $259,727 |
Source: Public Records
Map
Nearby Homes
- 10941 Waterton Rd
- 10616 Falcon Rim Point
- 10818 Caminito Arcada
- 11793 Alderhill Terrace
- 11954 Cypress Valley Dr
- 10415 Mesa Madera Dr
- 11629 Swan Lake Dr Unit 4
- 10535 Arbor Park Place
- 10405 White Birch Dr
- 10914 Ivy Hill Dr Unit 1
- 12026 Medoc Ln
- 10473 Crosscreek Terrace
- 11466 Tree Hollow Ln
- 11495 Cypress Canyon Rd
- 10304 Crosscreek Terrace
- 10466 Ridgewater Ln
- 11825 Miro Cir
- 11856 Miro Cir
- 11964 Ashley Place
- 11646 La Colina Rd
- 11226 Gatemoore Way Unit 13
- 11205 Gatemoore Way
- 11192 Gatemoore Way
- 11238 Gatemoore Way
- 11221 Gatemoore Way
- 11235 Gatemoore Way
- 11176 Gatemoore Way
- 11244 Gatemoore Way
- 11183 Gatemoore Way
- 11243 Gatemoore Way
- 11208 Sherrard Way
- 11224 Sherrard Way
- 11236 Sherrard Way
- 11165 Gatemoore Way
- 11252 Gatemoore Way
- 11220 Waldorf Way
- 11251 Gatemoore Way
- 11248 Sherrard Way
- 11153 Gatemoore Way
- 11264 Gatemoore Way