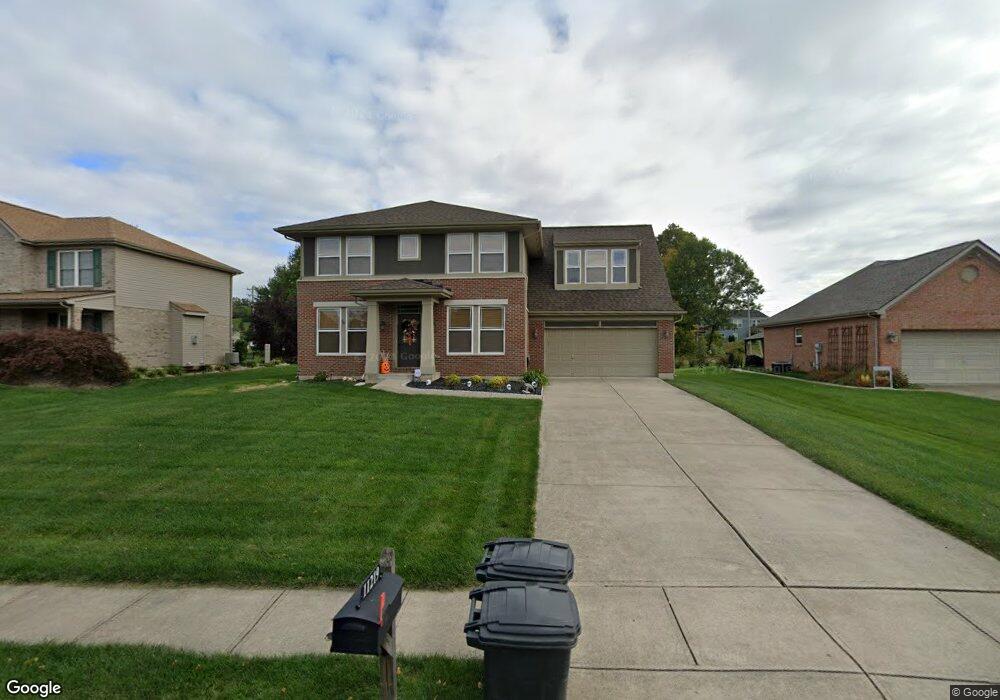
11219 Sugarmill Dr Unit 35 Alexandria, KY 41001
Estimated Value: $401,000 - $441,000
4
Beds
3
Baths
2,840
Sq Ft
$149/Sq Ft
Est. Value
About This Home
This home is located at 11219 Sugarmill Dr Unit 35, Alexandria, KY 41001 and is currently estimated at $424,233, approximately $149 per square foot. 11219 Sugarmill Dr Unit 35 is a home located in Campbell County with nearby schools including Grant's Lick Elementary School, Campbell County Middle School, and Campbell County High School.
Ownership History
Date
Name
Owned For
Owner Type
Purchase Details
Closed on
Dec 30, 2005
Sold by
Fischer Single Family Homes Ii Llc
Bought by
Baker C David and Waldrop Darlene E
Current Estimated Value
Home Financials for this Owner
Home Financials are based on the most recent Mortgage that was taken out on this home.
Original Mortgage
$208,905
Outstanding Balance
$112,005
Interest Rate
5.5%
Mortgage Type
Adjustable Rate Mortgage/ARM
Estimated Equity
$312,228
Purchase Details
Closed on
Feb 17, 2005
Sold by
Sun Valley Real Estate Co Llc
Bought by
Fischer Single Family Homes Ii Llc
Purchase Details
Closed on
Feb 11, 2005
Sold by
The Drees Co
Bought by
Sun Valley Real Estate Co Llc
Purchase Details
Closed on
Feb 16, 2004
Sold by
Sun Valley Real Estate Co Llc
Bought by
The Drees Co
Create a Home Valuation Report for This Property
The Home Valuation Report is an in-depth analysis detailing your home's value as well as a comparison with similar homes in the area
Home Values in the Area
Average Home Value in this Area
Purchase History
| Date | Buyer | Sale Price | Title Company |
|---|---|---|---|
| Baker C David | $219,900 | Homestead Title Agency Ltd | |
| Fischer Single Family Homes Ii Llc | $99,000 | -- | |
| Sun Valley Real Estate Co Llc | $96,000 | -- | |
| The Drees Co | $94,000 | -- |
Source: Public Records
Mortgage History
| Date | Status | Borrower | Loan Amount |
|---|---|---|---|
| Open | Baker C David | $208,905 |
Source: Public Records
Tax History Compared to Growth
Tax History
| Year | Tax Paid | Tax Assessment Tax Assessment Total Assessment is a certain percentage of the fair market value that is determined by local assessors to be the total taxable value of land and additions on the property. | Land | Improvement |
|---|---|---|---|---|
| 2024 | $3,064 | $300,000 | $40,000 | $260,000 |
| 2023 | $2,993 | $300,000 | $40,000 | $260,000 |
| 2022 | $3,198 | $300,000 | $40,000 | $260,000 |
| 2021 | $3,236 | $300,000 | $40,000 | $260,000 |
| 2020 | $2,423 | $229,300 | $30,500 | $198,800 |
| 2019 | $2,400 | $229,300 | $30,500 | $198,800 |
| 2018 | $2,437 | $229,300 | $30,500 | $198,800 |
| 2017 | $2,410 | $229,300 | $30,500 | $198,800 |
| 2016 | $2,366 | $229,300 | $0 | $0 |
| 2015 | $2,409 | $229,300 | $0 | $0 |
| 2014 | $2,366 | $229,300 | $0 | $0 |
Source: Public Records
Map
Nearby Homes
- Wembley Plan at The Reserve of Parkside - Paired Patio Homes Collection
- Charles Plan at The Reserve of Parkside - Designer Collection
- Magnolia Plan at The Reserve of Parkside - Designer Collection
- Winston Plan at The Reserve of Parkside - Designer Collection
- Emmett Plan at The Reserve of Parkside - Designer Collection
- Blair Plan at The Reserve of Parkside - Designer Collection
- Carrington Plan at The Reserve of Parkside - Designer Collection
- Wyatt Plan at The Reserve of Parkside - Designer Collection
- Avery Plan at The Reserve of Parkside - Designer Collection
- Calvin Plan at The Reserve of Parkside - Designer Collection
- Grandin Plan at The Reserve of Parkside - Designer Collection
- 1338 Parkside Dr
- 1325 Parkside Dr
- 1338 Parkside Dr Unit 154B
- 1334 Parkside Dr Unit 154A
- 11024 Farmview Dr
- 1325 Parkside Dr Unit 167A
- 1321 Parkside Dr Unit 167B
- 1321 Parkside Dr
- 10988 Dairybarn Ln
- 11219 Sugarmill Dr
- 11213 Sugarmill Dr
- 11225 Sugarmill Dr
- 11207 Sugarmill Dr
- 11231 Sugarmill Dr
- 1207 Parkside Dr
- 11220 Sugarmill Dr
- 11214 Sugarmill Dr
- 11228 Sugarmill Dr
- 11237 Sugarmill Dr
- 11237 Sugarmill Dr Unit 106
- 11206 Sugarmill Dr
- 1213 Parkside Dr
- 1213 Parkside Dr Unit 257
- 11236 Sugarmill Dr
- 1194 Parkside Dr
- 11241 Sugarmill Dr
- 1184 Rosebud Ct
- 1084 Rosebud Ct
- 1186 Parkside Dr