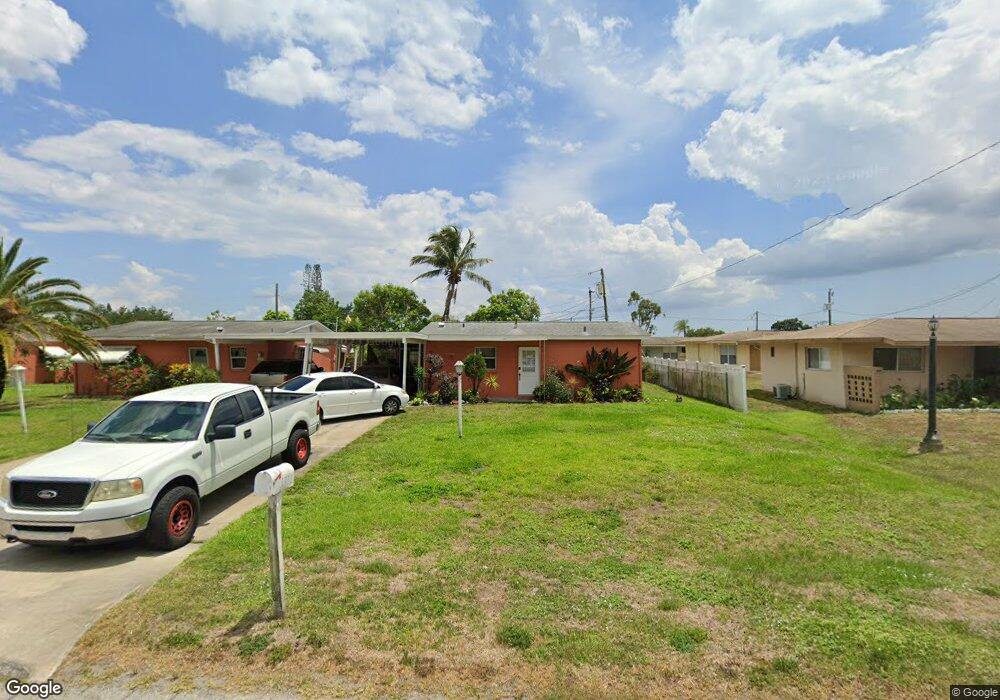
1122 Broad St N Unit 12 Lehigh Acres, FL 33936
Alabama NeighborhoodEstimated Value: $161,000 - $187,000
2
Beds
1
Bath
1,080
Sq Ft
$160/Sq Ft
Est. Value
About This Home
This home is located at 1122 Broad St N Unit 12, Lehigh Acres, FL 33936 and is currently estimated at $172,292, approximately $159 per square foot. 1122 Broad St N Unit 12 is a home located in Lee County with nearby schools including Lehigh Elementary School, Gateway Elementary School, and The Alva School.
Ownership History
Date
Name
Owned For
Owner Type
Purchase Details
Closed on
Dec 22, 2022
Sold by
Nodal Elvira
Bought by
Nodal Elvira
Current Estimated Value
Purchase Details
Closed on
Aug 8, 2014
Sold by
Yeakle Kimberly L
Bought by
Nodal Elvira
Purchase Details
Closed on
Aug 8, 2003
Sold by
Black Sharon G and Medina Gumersindo
Bought by
Yeakle Kimberly
Home Financials for this Owner
Home Financials are based on the most recent Mortgage that was taken out on this home.
Original Mortgage
$39,000
Interest Rate
5.42%
Purchase Details
Closed on
Jun 12, 2003
Sold by
Powers Esther F
Bought by
Black Sharon G
Home Financials for this Owner
Home Financials are based on the most recent Mortgage that was taken out on this home.
Original Mortgage
$39,000
Interest Rate
5.42%
Purchase Details
Closed on
Jan 20, 1998
Sold by
Omalley Robert J and Omalley Janet
Bought by
Powers Esther F
Create a Home Valuation Report for This Property
The Home Valuation Report is an in-depth analysis detailing your home's value as well as a comparison with similar homes in the area
Home Values in the Area
Average Home Value in this Area
Purchase History
| Date | Buyer | Sale Price | Title Company |
|---|---|---|---|
| Nodal Elvira | $100 | -- | |
| Nodal Elvira | $11,000 | Oak Hills Land Title Agency | |
| Yeakle Kimberly | $46,000 | -- | |
| Black Sharon G | -- | -- | |
| Powers Esther F | $31,000 | -- |
Source: Public Records
Mortgage History
| Date | Status | Borrower | Loan Amount |
|---|---|---|---|
| Previous Owner | Yeakle Kimberly | $39,000 |
Source: Public Records
Tax History Compared to Growth
Tax History
| Year | Tax Paid | Tax Assessment Tax Assessment Total Assessment is a certain percentage of the fair market value that is determined by local assessors to be the total taxable value of land and additions on the property. | Land | Improvement |
|---|---|---|---|---|
| 2025 | $2,331 | $146,640 | -- | -- |
| 2024 | $2,066 | $133,309 | -- | -- |
| 2023 | $2,066 | $121,190 | $14,027 | $106,620 |
| 2022 | $1,631 | $70,162 | $0 | $0 |
| 2021 | $1,388 | $80,607 | $6,375 | $74,232 |
| 2020 | $1,281 | $66,221 | $5,700 | $60,521 |
| 2019 | $1,350 | $63,794 | $4,800 | $58,994 |
| 2018 | $1,207 | $47,922 | $4,800 | $43,122 |
| 2017 | $1,157 | $46,031 | $4,800 | $41,231 |
| 2016 | $1,085 | $41,480 | $4,800 | $36,680 |
| 2015 | $1,027 | $37,699 | $4,000 | $33,699 |
| 2014 | $792 | $34,904 | $2,600 | $32,304 |
| 2013 | -- | $28,399 | $1,800 | $26,599 |
Source: Public Records
Map
Nearby Homes
- 1116 Broad St N
- 1106 Broad St N
- 1115 S Loop Blvd Unit H
- 1116 Westminster St W
- 22 Westminster St N
- 20 Westminster St N
- 1003 Arthur Ave
- 1134 Cherokee Ave
- 9114 Aegean Cir
- 0 Beth Stacey Blvd
- 710 Fillmore Ave Unit 9
- 9817 Maplecrest Cir
- 1101 Coolidge Ave
- 9084 Aegean Cir
- 18 Alcala Ave
- 9069 Aegean Cir
- 9189 Aegean Cir
- 804 Alcala Ave
- 20 Cosmopolitan Dr Unit 5
- 32 Cosmopolitan Dr
- 1120 Broad St N
- 1125 Vineyard St
- 1118 Broad St N
- 43 Vineyard St
- 1123 Vineyard St
- 41 Vineyard St
- 1121 Vineyard St
- 1129 Broad St N
- 1125 Broad St N
- 1114 Broad St N Unit 8
- 1127 Broad St N Unit 15
- 1119 Vineyard St
- 39 Vineyard St
- 1123 Broad Ct
- 1123 Broad Ct
- 1117 Vineyard St
- 37 Vineyard St
- 1121 Broad Ct
- 1122 Vineyard St
- 1120 Vineyard St