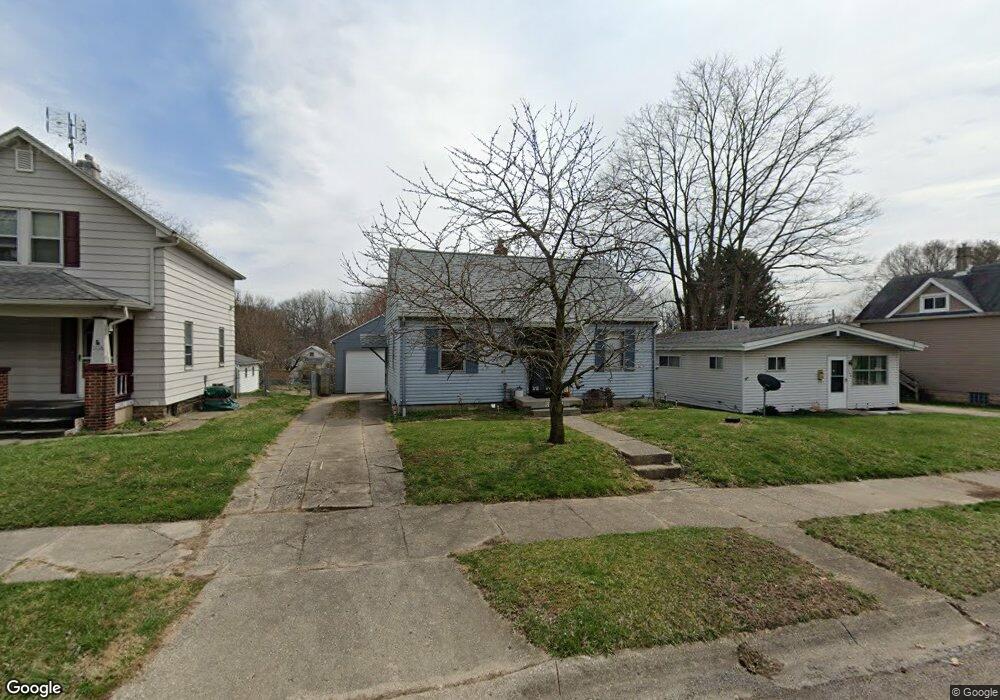
1122 Gable St Springfield, OH 45505
Estimated Value: $80,000 - $128,000
2
Beds
2
Baths
941
Sq Ft
$119/Sq Ft
Est. Value
About This Home
This home is located at 1122 Gable St, Springfield, OH 45505 and is currently estimated at $112,137, approximately $119 per square foot. 1122 Gable St is a home located in Clark County with nearby schools including Kenwood Elementary School, Hayward Middle School, and Springfield High School.
Ownership History
Date
Name
Owned For
Owner Type
Purchase Details
Closed on
May 14, 2020
Sold by
Baker Terry L
Bought by
Baker Sandra J
Current Estimated Value
Purchase Details
Closed on
Jan 5, 1995
Sold by
Cason Charles T
Bought by
Baker Terry L and Baker Sandra
Home Financials for this Owner
Home Financials are based on the most recent Mortgage that was taken out on this home.
Original Mortgage
$44,850
Interest Rate
9.27%
Mortgage Type
VA
Purchase Details
Closed on
May 8, 1991
Create a Home Valuation Report for This Property
The Home Valuation Report is an in-depth analysis detailing your home's value as well as a comparison with similar homes in the area
Home Values in the Area
Average Home Value in this Area
Purchase History
| Date | Buyer | Sale Price | Title Company |
|---|---|---|---|
| Baker Sandra J | -- | None Available | |
| Baker Terry L | $44,000 | -- | |
| -- | $34,900 | -- |
Source: Public Records
Mortgage History
| Date | Status | Borrower | Loan Amount |
|---|---|---|---|
| Closed | Baker Terry L | $44,850 |
Source: Public Records
Tax History
| Year | Tax Paid | Tax Assessment Tax Assessment Total Assessment is a certain percentage of the fair market value that is determined by local assessors to be the total taxable value of land and additions on the property. | Land | Improvement |
|---|---|---|---|---|
| 2025 | $768 | $34,000 | $5,160 | $28,840 |
| 2024 | -- | $25,320 | $4,830 | $20,490 |
| 2023 | $778 | $25,320 | $4,830 | $20,490 |
| 2022 | $429 | $25,320 | $4,830 | $20,490 |
| 2021 | $458 | $17,310 | $2,950 | $14,360 |
| 2020 | $928 | $17,310 | $2,950 | $14,360 |
| 2019 | $930 | $17,310 | $2,950 | $14,360 |
| 2018 | $955 | $17,070 | $2,770 | $14,300 |
| 2017 | $954 | $19,443 | $2,765 | $16,678 |
| 2016 | $522 | $19,443 | $2,765 | $16,678 |
| 2015 | $682 | $17,476 | $2,765 | $14,711 |
| 2014 | $605 | $17,476 | $2,765 | $14,711 |
| 2013 | $796 | $17,476 | $2,765 | $14,711 |
Source: Public Records
Map
Nearby Homes
- 908 Pine St
- 1225 Beacon St
- 1111 Lafayette Ave
- 920 Oak St
- 1440 Selma Rd
- 1652 Kenton St
- 1714 Kenton St
- 900 E Rose St
- 453 E Pleasant St
- 1609 Irwin Ave
- 652 E Southern Ave
- 1554 S Belmont Ave
- 1806 N Sweetbriar Ln
- 1630 S Sweetbriar Ln
- 360 S Greenmount Ave
- 1008 Tibbetts Ave
- 1724 S Belmont Ave
- 2108 Sunset Ave
- 718 Summer St
- 321 Glenn Ave
Your Personal Tour Guide
Ask me questions while you tour the home.