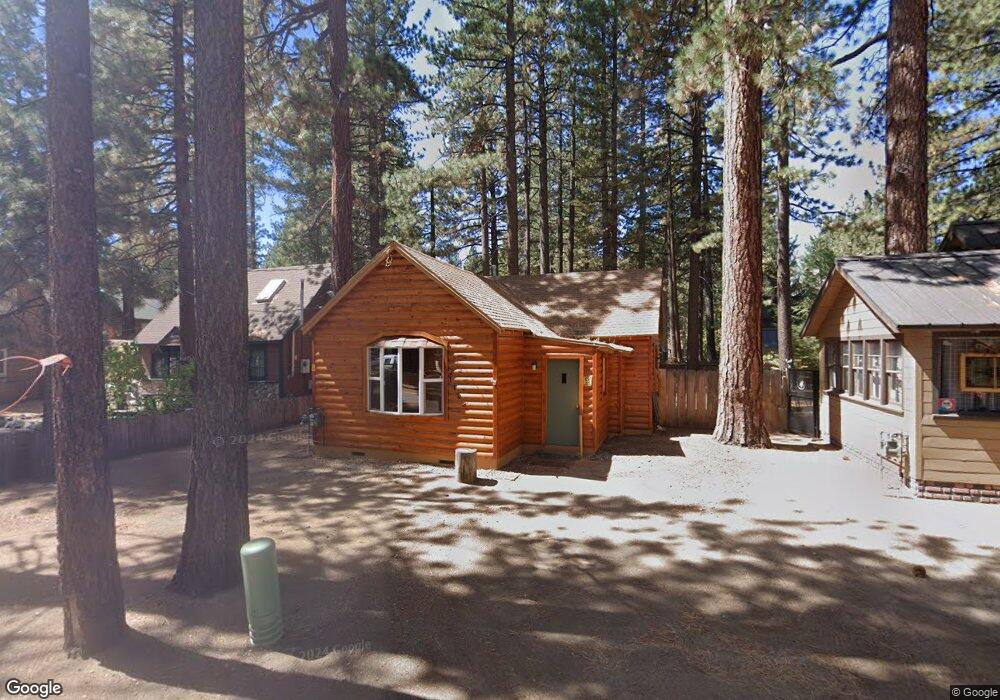
1122 Juniper Ave South Lake Tahoe, CA 96150
Estimated Value: $415,336 - $509,000
2
Beds
1
Bath
1,032
Sq Ft
$455/Sq Ft
Est. Value
About This Home
This home is located at 1122 Juniper Ave, South Lake Tahoe, CA 96150 and is currently estimated at $469,334, approximately $454 per square foot. 1122 Juniper Ave is a home located in El Dorado County with nearby schools including Bijou Community, South Tahoe Middle School, and South Tahoe High School.
Ownership History
Date
Name
Owned For
Owner Type
Purchase Details
Closed on
Jan 27, 2024
Sold by
Reid Laurence A
Bought by
Laurence Albert Reid Living Trust and Reid
Current Estimated Value
Purchase Details
Closed on
Aug 25, 2010
Sold by
Pleas Donna A and Palmieri Michael J
Bought by
Reid Laurence A
Purchase Details
Closed on
Jan 28, 2002
Sold by
Palmieri Michael J and Pleas Donna A
Bought by
Palmieri Michael J and Pleas Donna A
Home Financials for this Owner
Home Financials are based on the most recent Mortgage that was taken out on this home.
Original Mortgage
$105,000
Interest Rate
7.17%
Purchase Details
Closed on
Sep 24, 1999
Sold by
Nickel Jeanne E 1990 Revocable Living Tr and Nickel James Ernest Co Tr Etal
Bought by
Palmieri Michael J and Pleas Donna A
Home Financials for this Owner
Home Financials are based on the most recent Mortgage that was taken out on this home.
Original Mortgage
$77,600
Interest Rate
7.76%
Create a Home Valuation Report for This Property
The Home Valuation Report is an in-depth analysis detailing your home's value as well as a comparison with similar homes in the area
Home Values in the Area
Average Home Value in this Area
Purchase History
| Date | Buyer | Sale Price | Title Company |
|---|---|---|---|
| Laurence Albert Reid Living Trust | -- | None Listed On Document | |
| Reid Laurence A | $99,100 | Fidelity Natl Title Co | |
| Palmieri Michael J | -- | Placer Title Company | |
| Palmieri Michael J | $97,000 | Old Republic Title Company |
Source: Public Records
Mortgage History
| Date | Status | Borrower | Loan Amount |
|---|---|---|---|
| Previous Owner | Palmieri Michael J | $105,000 | |
| Previous Owner | Palmieri Michael J | $77,600 |
Source: Public Records
Tax History Compared to Growth
Tax History
| Year | Tax Paid | Tax Assessment Tax Assessment Total Assessment is a certain percentage of the fair market value that is determined by local assessors to be the total taxable value of land and additions on the property. | Land | Improvement |
|---|---|---|---|---|
| 2025 | $1,415 | $126,820 | $74,300 | $52,520 |
| 2024 | $1,415 | $124,335 | $72,844 | $51,491 |
| 2023 | $1,392 | $121,898 | $71,416 | $50,482 |
| 2022 | $1,378 | $119,509 | $70,016 | $49,493 |
| 2021 | $1,357 | $117,167 | $68,644 | $48,523 |
| 2020 | $1,338 | $115,967 | $67,941 | $48,026 |
| 2019 | $1,332 | $113,694 | $66,609 | $47,085 |
| 2018 | $1,304 | $111,465 | $65,303 | $46,162 |
| 2017 | $1,284 | $109,280 | $64,023 | $45,257 |
| 2016 | $1,259 | $107,138 | $62,768 | $44,370 |
| 2015 | $1,197 | $105,530 | $61,826 | $43,704 |
| 2014 | $1,197 | $103,465 | $60,616 | $42,849 |
Source: Public Records
Map
Nearby Homes
- 3339 Cape Horn Rd
- 3334 Treehaven Dr
- 1149 Oak Ave
- 3338 Treehaven Dr
- 1048 Trout Creek Ave
- 3275 Marlette Cir
- 1094 Johnson Blvd
- 3229 Marlette Cir
- 960 San Francisco Ave
- 3371 Lake Tahoe Blvd Unit 6
- 1022 Fairway Ave
- 3520 Cloverdale Ave
- 1201 Glenwood Way
- 3508 Fawn Way
- 1115 Glenwood Way
- 1151 Herbert Ave Unit B
- 3140 Sacramento Ave
- 920 Balbijou Rd Unit 229
- 3510 Rancho Cir
- 1304 Susie Lake Rd
- 1130 Juniper Ave
- 1120 Juniper Ave
- 1134 Juniper Ave
- 1127 Craig Ave
- 1125 Craig Ave
- 1116 Juniper Ave
- 3300 Pickett Ave
- 1135 Craig Ave
- 1127 Juniper Ave
- 1138 Juniper Ave
- 1123 Juniper Ave
- 1119 Juniper Ave
- 1117 Craig Ave
- 3317 Fir Ave
- 1139 Craig Ave
- 2 Juniper Tract
- 1142 Juniper Ave
- 1115 Juniper Ave
- 1143 Craig Ave
- 1141 Juniper Ave